SunTrust 2003 Annual Report Download - page 69
Download and view the complete annual report
Please find page 69 of the 2003 SunTrust annual report below. You can navigate through the pages in the report by either clicking on the pages listed below, or by using the keyword search tool below to find specific information within the annual report.-
 1
1 -
2
-
3
-
4
-
5
-
6
-
7
-
8
-
9
-
10
-
11
-
12
-
13
-
14
-
15
-
16
-
17
-
18
-
19
-
20
-
21
-
22
-
23
-
24
-
25
-
26
-
27
-
28
-
29
-
30
-
31
-
32
-
33
-
34
-
35
-
36
-
37
-
38
-
39
-
40
-
41
-
42
-
43
-
44
-
45
-
46
-
47
-
48
-
49
-
50
-
51
-
52
-
53
-
54
-
55
-
56
-
57
-
58
-
 59
59 -
 60
60 -
 61
61 -
 62
62 -
 63
63 -
 64
64 -
 65
65 -
 66
66 -
 67
67 -
 68
68 -
 69
69 -
 70
70 -
 71
71 -
 72
72 -
 73
73 -
 74
74 -
 75
75 -
 76
76 -
 77
77 -
 78
78 -
 79
79 -
80
-
81
-
82
-
83
-
84
-
85
-
86
-
87
-
88
-
89
-
90
-
91
-
92
-
93
-
94
-
95
-
96
-
97
-
98
-
99
-
100
-
101
-
102
-
103
-
104
 |
 |

Annual Report 2003 SunTrust Banks, Inc. 67
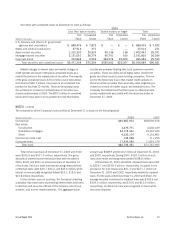
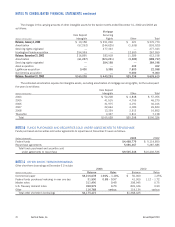
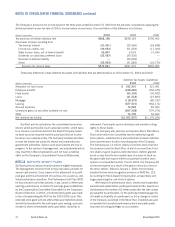
Total nonaccrual loans at December 31, 2003 and 2002
were $336.5 and $511.0 million, respectively. The gross
amounts of interest income that would have been recorded in
2003, 2002, and 2001 on nonaccrual loans at December 31
of each year, if all such loans had been accruing interest at their
contractual rates, were $33.7, $45.2, and $45.6 million, while
interest income actually recognized totaled $14.1, $15.6, and
$15.8 million, respectively.
In the normal course of business, the Company’s banking
subsidiary has made loans at prevailing interest rates and terms
to directors and executive officers of the Company and its sub-
sidiaries, and to their related interests. The aggregate dollar
amount was $408.9 and $410.2 million at December 31, 2003
and 2002, respectively. During 2003, $197.5 million of such
loans were made and repayments totaled $198.8 million.
At December 31, 2003 and 2002, impaired loans amounted
to $229.7 and $399.3 million, respectively. Included in the
allowance for loan losses was $41.3 and $121.7 million at
December 31, 2003 and 2002, respectively related to impaired
loans. For the years ended December 31, 2003 and 2002, the
average recorded investment in impaired loans was $359.6 and
$424.6 million, respectively; and $10.0 and $10.6 million,
respectively, of interest income was recognized on loans while
they were impaired.
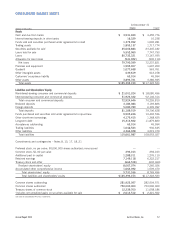
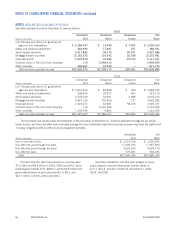
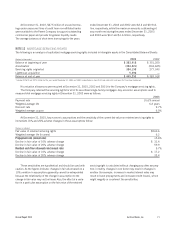
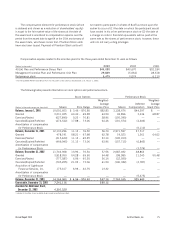
Securities with unrealized losses at December 31 were as follows:
2003
Less than twelve months Twelve months or longer Total
Fair Unrealized Fair Unrealized Fair Unrealized
(Dollars in thousands) Value Losses Value Losses Value Losses
U.S. Treasury and other U.S. government
agencies and corporations $689,476 $ 7,872 $ — $ — $ 689,476 $ 7,872
States and political subdivisions 27,512 271 — — 27,512 271
Asset-backed securities 1,312,307 25,933 90,136 138 1,402,443 26,071
Mortgage-backed securities 3,131,051 26,774 60,751 160 3,191,802 26,934
Corporate bonds 310,863 9,504 384,573 20,009 695,436 29,513
Total securities with unrealized losses $5,471,209 $70,354 $535,460 $20,307 $6,006,669 $90,661
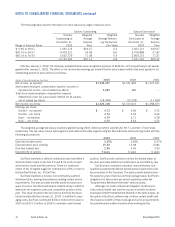
NOTE 6
LOANS
The composition of the Company’s loan portfolio at December 31 is shown in the following table:
(Dollars in thousands) 2003 2002
Commercial $30,681,914 $28,693,616
Real estate
Construction 4,479,771 4,002,439
Residential mortgages 24,173,441 19,443,445
Other 9,330,114 9,101,801
Commercial credit card 132,998 111,255
Consumer loans 11,934,083 11,815,379
Total loans $80,732,321 $73,167,935
Market changes in interest rates and market changes in
credit spreads will result in temporary unrealized losses as a
normal fluctuation in the market price of securities. The majority
of the gross unrealized losses, $70.4 million out of total unreal-
ized losses of $90.7 million, have been in an unrealized loss
position for less than 12 months. These are temporary losses
due primarily to increases in interest rates on securities pur-
chased predominately in 2003. The $20.3 million in unrealized
losses which have been in a loss position for more than twelve
months are primarily floating-rate, trust preferred corporate
securities. These securities are all highly-rated, investment
grade securities issued by bank holding companies. The rea-
son for the temporary loss is that market credit spreads on
these securities are wider than when they were originally pur-
chased as a result of market supply and demand factors. The
Company has determined that there were no other than tem-
porary impairments associated with the above securities at
December 31, 2003.