SunTrust 2003 Annual Report Download - page 49
Download and view the complete annual report
Please find page 49 of the 2003 SunTrust annual report below. You can navigate through the pages in the report by either clicking on the pages listed below, or by using the keyword search tool below to find specific information within the annual report.-
 1
1 -
2
-
3
-
4
-
5
-
6
-
7
-
8
-
9
-
10
-
11
-
12
-
13
-
14
-
15
-
16
-
17
-
18
-
19
-
20
-
21
-
22
-
23
-
24
-
25
-
26
-
27
-
28
-
29
-
30
-
31
-
32
-
33
-
34
-
35
-
36
-
37
-
38
-
 39
39 -
 40
40 -
 41
41 -
 42
42 -
 43
43 -
 44
44 -
 45
45 -
 46
46 -
 47
47 -
 48
48 -
 49
49 -
 50
50 -
 51
51 -
 52
52 -
 53
53 -
 54
54 -
 55
55 -
 56
56 -
 57
57 -
 58
58 -
 59
59 -
60
-
61
-
62
-
63
-
64
-
65
-
66
-
67
-
68
-
69
-
70
-
71
-
72
-
73
-
74
-
75
-
76
-
77
-
78
-
79
-
80
-
81
-
82
-
83
-
84
-
85
-
86
-
87
-
88
-
89
-
90
-
91
-
92
-
93
-
94
-
95
-
96
-
97
-
98
-
99
-
100
-
101
-
102
-
103
-
104
 |
 |

Annual Report 2003 SunTrust Banks, Inc. 47
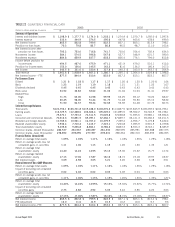
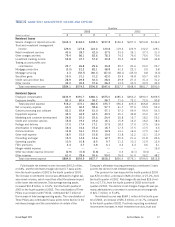
TABLE 25
QUARTERLY NONINTEREST INCOME AND EXPENSE
Quarters
2003 2002
(Dollars in millions) 43214321
Noninterest Income
Service charges on deposit accounts $165.3 $162.0 $158.0 $157.8 $156.2 $157.0 $153.8 $146.0
Trust and investment management
income 129.6 127.8 124.2 120.8 119.4 123.9 132.2 129.1
Retail investment services 43.6 38.7 42.0 37.5 33.0 35.1 37.3 31.3
Other charges and fees 79.4 86.1 82.6 78.3 74.3 76.6 75.6 70.4
Investment banking income 53.8 47.7 57.2 33.8 39.5 39.8 52.8 44.8
Trading account profits and
commissions 22.7 26.8 29.6 30.8 29.7 23.6 24.2 25.7
Mortgage production (3.0) 32.2 82.1 38.8 61.3 22.3 3.0 5.8
Mortgage servicing 2.3 (52.7) (80.1) (47.0) (68.1) (36.5) 0.8 (6.3)
Securities gains 19.5 31.1 31.2 42.0 39.5 45.8 55.7 63.5
Credit card and other fees 28.9 29.6 32.4 28.6 29.9 27.4 31.4 31.2
Other income 42.0 45.2 37.6 26.2 13.0 33.9 34.9 49.0
Total noninterest income $584.1 $574.5 $596.8 $547.6 $527.7 $548.9 $601.7 $590.5
Noninterest Expense
Employee compensation $432.9 $391.7 $386.4 $375.0 $385.2 $363.2 $394.3 $369.5
Employee benefits 83.3 80.4 96.2 98.7 71.0 72.2 72.5 90.8
Total personnel expense 516.2 472.1 482.6 473.7 456.2 435.4 466.8 460.3
Net occupancy expense 60.5 60.5 58.6 57.7 61.7 57.6 55.9 54.0
Outside processing and software 63.2 65.4 61.0 57.1 57.0 59.9 54.0 54.3
Equipment expense 45.5 44.9 44.5 43.5 45.1 42.8 43.2 43.7
Marketing and customer development 24.8 25.0 25.6 24.9 20.8 15.7 18.2 25.2
Credit and collection services 15.8 19.3 19.2 16.1 15.9 14.2 16.2 18.3
Postage and delivery 17.0 17.4 17.1 17.5 18.3 17.0 17.5 16.6
Amortization of intangible assets 16.4 16.2 15.2 16.7 17.5 17.5 17.5 6.5
Communications 14.8 16.1 15.4 14.9 14.1 16.6 17.5 16.7
Other staff expense 18.9 15.0 15.8 10.6 13.8 12.2 12.1 13.9
Consulting and legal 15.9 14.2 14.6 12.7 25.0 21.6 21.8 22.6
Operating supplies 10.9 10.8 8.5 9.7 11.2 10.3 12.9 12.4
FDIC premiums 4.4 4.7 4.8 4.1 4.2 4.4 4.6 4.1
Merger-related expense ———————16.0
Other real estate expense (income) (0.9) (0.3) (0.8) — 0.3 (0.1) (0.4) —
Other expense 61.4 78.6 55.6 59.0 75.3 51.0 36.2 48.2
Total noninterest expense $884.8 $859.9 $837.7 $818.2 $836.4 $776.1 $794.0 $812.8
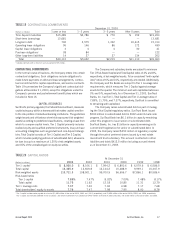
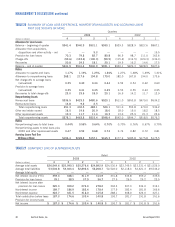
Fully-taxable net interest income increased $40.2 million,
or 4.8%, and the net interest margin declined 17 basis points
from the fourth quarter of 2002 to the fourth quarter of 2003.
The increase in net interest income was attributed to higher bal-
ance sheet volumes, which more than offset the adverse impact
of the lower rate environment. Total average earning assets
increased $10.8 billion, or 10.6%, from the fourth quarter of
2002 to the fourth quarter of 2003. The consolidation of Three
Pillars in accordance with FIN 46, contributed $2.7 billion of
the increase in total average earning assets. The consolidation of
Three Pillars also contributed 6 basis points to the decline in the
net interest margin and the consolidation of certain of the
Company’s affordable housing partnerships contributed 1 basis
point to the decline in net interest margin.
The provision for loan losses for the fourth quarter of 2003
was $70.3 million, a decrease of $26.2 million, or 27.2%, from
the fourth quarter of 2002. Net charge-offs declined $25.9 mil-
lion, or 27.1%, from the fourth quarter of 2002 to the fourth
quarter of 2003. The decline in net charges charge-offs was pri-
marily attributable to a decrease in commercial net charge-offs
of $21.7 million, or 51.8%.
Noninterest income was $584.1 million in the fourth quar-
ter of 2003, an increase of $56.3 million, or 10.7%, compared
to the fourth quarter of 2002. Positively impacting noninterest
income were increases in retail investment services, trust and