SunTrust 2003 Annual Report Download - page 51
Download and view the complete annual report
Please find page 51 of the 2003 SunTrust annual report below. You can navigate through the pages in the report by either clicking on the pages listed below, or by using the keyword search tool below to find specific information within the annual report.-
 1
1 -
2
-
3
-
4
-
5
-
6
-
7
-
8
-
9
-
10
-
11
-
12
-
13
-
14
-
15
-
16
-
17
-
18
-
19
-
20
-
21
-
22
-
23
-
24
-
25
-
26
-
27
-
28
-
29
-
30
-
31
-
32
-
33
-
34
-
35
-
36
-
37
-
38
-
39
-
40
-
 41
41 -
 42
42 -
 43
43 -
 44
44 -
 45
45 -
 46
46 -
 47
47 -
 48
48 -
 49
49 -
 50
50 -
 51
51 -
 52
52 -
 53
53 -
 54
54 -
 55
55 -
 56
56 -
 57
57 -
 58
58 -
 59
59 -
 60
60 -
 61
61 -
62
-
63
-
64
-
65
-
66
-
67
-
68
-
69
-
70
-
71
-
72
-
73
-
74
-
75
-
76
-
77
-
78
-
79
-
80
-
81
-
82
-
83
-
84
-
85
-
86
-
87
-
88
-
89
-
90
-
91
-
92
-
93
-
94
-
95
-
96
-
97
-
98
-
99
-
100
-
101
-
102
-
103
-
104
 |
 |

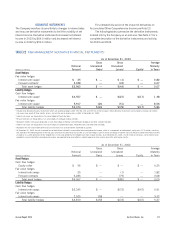
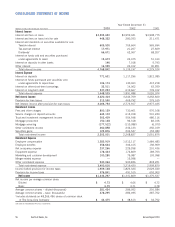
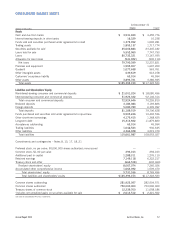
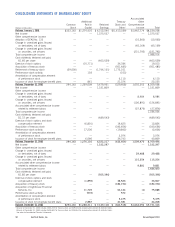
Annual Report 2003 SunTrust Banks, Inc. 49
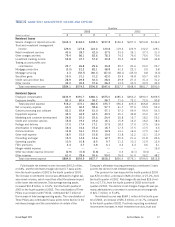
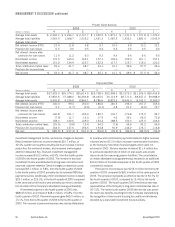
Commercial
2003 2002
(Dollars in millions) 432143 21
Average total assets $23,847.4 $23,757.2 $23,425.0 $22,535.1 $22,058.2 $21,412.2 $21,305.5 $20,262.1
Average total liabilities 11,620.6 11,070.5 10,401.9 10,199.8 9,823.2 9,053.0 8,469.9 8,153.8
Average total equity — — — — — — — —
Net interest income (FTE) 153.9 151.1 141.1 139.4 138.6 134.1 133.0 127.9
Provision for loan losses 6.6 12.3 11.6 11.3 11.2 7.2 10.3 9.8
Net interest income after
provision for loan losses 147.3 138.8 129.5 128.1 127.4 126.9 122.7 118.1
Noninterest income 83.9 87.6 66.5 68.7 58.3 52.9 55.9 61.1
Noninterest expense 94.8 103.9 80.7 79.2 97.6 73.5 78.4 89.5
Total contribution before taxes 136.4 122.5 115.3 117.6 88.1 106.3 100.2 89.7
Provision for income taxes — — — — — — — —
Net income $ 136.4 $ 122.5 $ 115.3 $ 117.6 $ 88.1 $ 106.3 $ 100.2 $ 89.7
Corporate & Investment Banking
2003 2002
(Dollars in millions) 432143 21
Average total assets $21,469.9 $24,349.5 $21,444.5 $22,268.6 $22,376.7 $21,376.8 $20,974.3 $22,017.4
Average total liabilities 9,340.0 11,642.1 7,560.1 7,738.4 7,394.6 6,261.0 5,775.1 6,000.2
Average total equity — — — — — — — —
Net interest income (FTE) 76.1 72.9 68.9 62.1 63.4 63.0 65.8 76.3
Provision for loan losses 16.9 28.0 31.3 31.0 50.8 41.7 79.4 55.2
Net interest income after
provision for loan losses 59.2 44.9 37.6 31.1 12.6 21.3 (13.6) 21.1
Noninterest income 137.3 133.3 153.7 123.2 133.3 126.3 140.1 127.0
Noninterest expense 95.5 94.3 90.7 88.0 80.5 83.9 93.4 107.8
Total contribution before taxes 101.0 83.9 100.6 66.3 65.4 63.7 33.1 40.3
Provision for income taxes — — — — — — — —
Net income $ 101.0 $ 83.9 $ 100.6 $ 66.3 $ 65.4 $ 63.7 $ 33.1 $ 40.3
Mortgage
2003 2002
(Dollars in millions) 432143 21
Average total assets $22,597.0 $24,933.8 $21,549.3 $20,850.7 $20,030.8 $18,005.1 $17,846.1 $18,813.6
Average total liabilities 1,458.4 2,392.1 1,900.5 1,446.0 1,562.3 1,166.5 1,151.9 1,177.2
Average total equity — — — — — — — —
Net interest income (FTE) 129.7 161.1 128.7 126.4 112.1 82.3 87.8 92.4
Provision for loan losses 1.9 1.8 1.6 1.5 1.5 1.6 1.6 1.7
Net interest income after
provision for loan losses 127.8 159.3 127.1 124.9 110.6 80.7 86.2 90.7
Noninterest income 8.6 (10.4) 14.1 2.4 5.1 (7.8) 11.2 4.9
Noninterest expense 82.5 82.7 73.6 68.7 64.0 44.9 53.5 61.5
Total contribution before taxes 53.9 66.2 67.6 58.6 51.7 28.0 43.9 34.1
Provision for income taxes — — — — — — — —
Net income $ 53.9 $ 66.2 $ 67.6 $ 58.6 $ 51.7 $ 28.0 $ 43.9 $ 34.1