SunTrust 2003 Annual Report Download - page 31
Download and view the complete annual report
Please find page 31 of the 2003 SunTrust annual report below. You can navigate through the pages in the report by either clicking on the pages listed below, or by using the keyword search tool below to find specific information within the annual report.-
 1
1 -
2
-
3
-
4
-
5
-
6
-
7
-
8
-
9
-
10
-
11
-
12
-
13
-
14
-
15
-
16
-
17
-
18
-
19
-
20
-
 21
21 -
 22
22 -
 23
23 -
 24
24 -
 25
25 -
 26
26 -
 27
27 -
 28
28 -
 29
29 -
 30
30 -
 31
31 -
 32
32 -
 33
33 -
 34
34 -
 35
35 -
 36
36 -
 37
37 -
 38
38 -
 39
39 -
 40
40 -
 41
41 -
42
-
43
-
44
-
45
-
46
-
47
-
48
-
49
-
50
-
51
-
52
-
53
-
54
-
55
-
56
-
57
-
58
-
59
-
60
-
61
-
62
-
63
-
64
-
65
-
66
-
67
-
68
-
69
-
70
-
71
-
72
-
73
-
74
-
75
-
76
-
77
-
78
-
79
-
80
-
81
-
82
-
83
-
84
-
85
-
86
-
87
-
88
-
89
-
90
-
91
-
92
-
93
-
94
-
95
-
96
-
97
-
98
-
99
-
100
-
101
-
102
-
103
-
104
 |
 |
Annual Report 2003 SunTrust Banks, Inc. 29
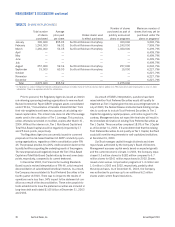
allowance reflects the margin for imprecisions in data and ana-
lytics inherent in most estimation processes.
During 2003, the Company substantially completed the
conversion of its credit risk rating system to a two dimensional
framework as prescribed in the Basel II Capital Accord. This
revision effectively rerated all major credit portfolios at both the
obligor and obligation levels. The Company also revised several
credit data gathering functions, centralized the administration of
loans individually reviewed under SFAS No. 114 and enhanced
its economic risk component. The qualitative risk factors of this
third allowance element are subjective and require a high degree
of management judgment. As of December 31, 2003 and 2002,
the allowance calculated in the third element totaled $348 mil-
lion and $276 million, respectively. The change between the two
periods was the result of enhancements to the economic risk
assessment mentioned above along with increases in the admin-
istrative risk and unallocated components.
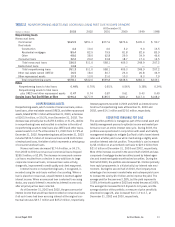
The Company’s provision for loan losses in 2003 was
$313.6 million, which exceeded net charge-offs of $311.1 mil-
lion by $2.5 million. The comparable provision and net charge-off
amounts for 2002 were $469.8 million and $422.3 million,
respectively. Provision expense decreased from 2002 to 2003
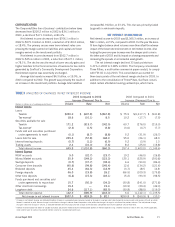
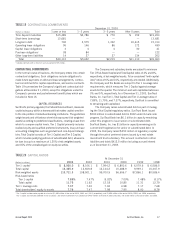
TABLE 8
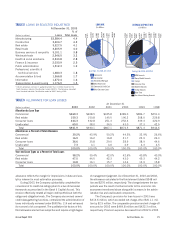
LOANS BY SELECTED INDUSTRIES1
At December 31, 2003
% of
(Dollars in millions) Loans Total Loans
Manufacturing $3,584.4 4.4
Construction 3,404.7 4.2
Real estate 3,327.5 4.1
Retail trade 3,205.9 4.0
Business services & nonprofits 3,101.1 3.8
Wholesale trade 2,546.5 3.2
Health & social assistance 2,243.8 2.8
Finance & insurance 2,030.9 2.5
Public administration 1,512.3 1.9
Professional, scientific &
technical services 1,480.3 1.8
Accommodation & food 1,366.8 1.7
Information 1,272.4 1.6
Transportation & warehousing 1,176.9 1.5
1Industry groupings are loans in aggregate greater than $1 billion based on the
North American Industry Classification System (NAICS). The Company converted
from Standard Industrial Classification codes to NAICS during 2003.
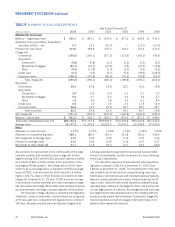
TABLE 9
ALLOWANCE FOR LOAN LOSSES
At December 31
(Dollars in millions) 2003 2002 2001 2000 1999 1998
Allocation by Loan Type
Commercial $369.3 $408.5 $435.8 $389.0 $286.7 $251.4
Real estate 159.3 150.8 145.5 190.2 208.0 229.8
Consumer loans 344.3 332.8 251.3 252.3 339.3 420.9
Unallocated 69.0 38.0 34.5 43.0 37.3 42.5
Total $941.9 $930.1 $867.1 $874.5 $871.3 $944.6
Allocation as a Percent of Total Allowance
Commercial 39.2% 43.9% 50.2% 44.5% 32.9% 26.6%
Real estate 16.9 16.2 16.8 21.7 23.9 24.3
Consumer loans 36.6 35.8 29.0 28.9 38.9 44.6
Unallocated 7.3 4.1 4.0 4.9 4.3 4.5
Total 100.0% 100.0% 100.0% 100.0% 100.0% 100.0%
Year-end Loan Types as a Percent of Total Loans
Commercial 38.2% 39.4% 42.0% 42.6% 40.8% 40.0%
Real estate 47.0 44.5 42.3 43.0 45.3 44.2
Consumer loans 14.8 16.1 15.7 14.4 13.9 15.8
Total 100.0% 100.0% 100.0% 100.0% 100.0% 100.0%
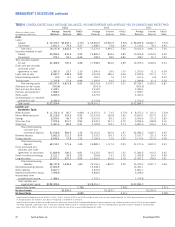
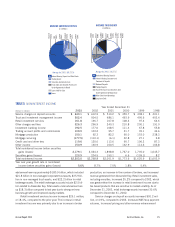
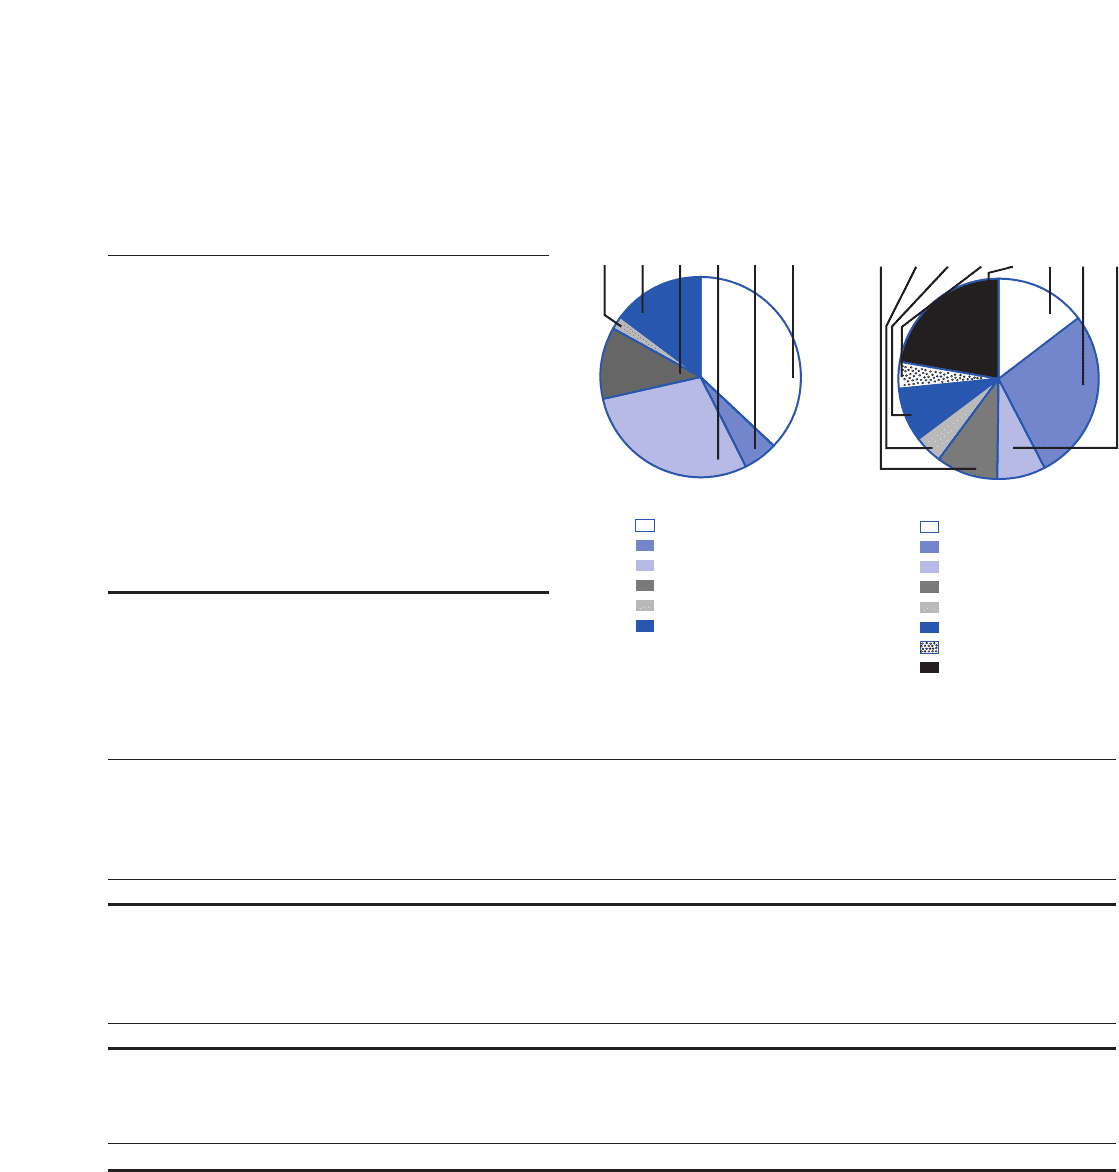
AVERAGE DEPOSIT MIX
$ in Millions
Average for 2003: 80,039.0
3,662.0
4.59%
7,975.4
9.96%
6,933.3
8.66%
3,461.6
4.32%
17,826.9
22.27%
11,702.0
14.62%
22,218.5
27.76%
6,259.3
7.82%
NOW Accounts
Money Market Accounts
Savings
Consumer Time
Brokered Deposits
Foreign Deposits
Other Time
Non-Interest Bearing Accounts
LOAN MIX
$ in Millions
As of Dec. 31 2003: 80,732.3
133.0
0.17%
11,934.1
14.78%
9,330.1
11.56%
24,173.4
29.94%
4,479.8
5.55%
30,681.9
38.00%
Commercial
Construction
Residential Mortgage
Other Real Estate
Commercial Credit Card
Other Consumer Loans