SunTrust 2003 Annual Report Download - page 47
Download and view the complete annual report
Please find page 47 of the 2003 SunTrust annual report below. You can navigate through the pages in the report by either clicking on the pages listed below, or by using the keyword search tool below to find specific information within the annual report.-
 1
1 -
2
-
3
-
4
-
5
-
6
-
7
-
8
-
9
-
10
-
11
-
12
-
13
-
14
-
15
-
16
-
17
-
18
-
19
-
20
-
21
-
22
-
23
-
24
-
25
-
26
-
27
-
28
-
29
-
30
-
31
-
32
-
33
-
34
-
35
-
36
-
 37
37 -
 38
38 -
 39
39 -
 40
40 -
 41
41 -
 42
42 -
 43
43 -
 44
44 -
 45
45 -
 46
46 -
 47
47 -
 48
48 -
 49
49 -
 50
50 -
 51
51 -
 52
52 -
 53
53 -
 54
54 -
 55
55 -
 56
56 -
 57
57 -
58
-
59
-
60
-
61
-
62
-
63
-
64
-
65
-
66
-
67
-
68
-
69
-
70
-
71
-
72
-
73
-
74
-
75
-
76
-
77
-
78
-
79
-
80
-
81
-
82
-
83
-
84
-
85
-
86
-
87
-
88
-
89
-
90
-
91
-
92
-
93
-
94
-
95
-
96
-
97
-
98
-
99
-
100
-
101
-
102
-
103
-
104
 |
 |

Annual Report 2003 SunTrust Banks, Inc. 45
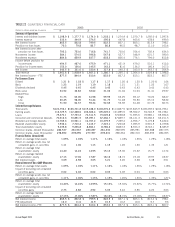
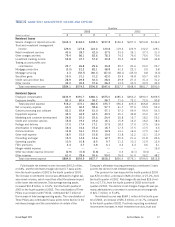
TABLE 23
QUARTERLY FINANCIAL DATA
(Dollars in millions except per share data)
2003 2002
43 2 1 4321
Summary of Operations
Interest and dividend income $1,198.9 $ 1,177.7 $ 1,174.0 $ 1,218.1 $1,274.9 $ 1,270.7 $ 1,292.0 $ 1,297.6
Interest expense 333.4 344.9 374.5 395.6 447.8 465.6 478.6 499.5
Net interest income 865.5 832.8 799.5 822.5 827.1 805.1 813.4 798.1
Provision for loan losses 70.3 79.8 82.7 80.8 96.5 98.7 111.0 163.6
Net interest income after
provision for loan losses 795.2 753.0 716.8 741.7 730.6 706.4 702.4 634.5
Noninterest income 584.1 574.5 596.8 547.6 527.7 548.9 601.7 590.5
Noninterest expense 884.8 859.9 837.7 818.2 836.4 776.1 794.0 812.8
Income before provision for
income taxes 494.5 467.6 475.9 471.1 421.9 479.2 510.1 412.2
Provision for income taxes 152.0 136.0 145.5 143.3 81.6 136.2 166.4 107.3
Net income $342.5 $ 331.6 $ 330.4 $ 327.8 $340.3 $ 343.0 $ 343.7 $ 304.9
Total revenue $1,461.6 $ 1,418.9 $ 1,407.2 $ 1,380.7 $1,365.1 $ 1,364.0 $ 1,424.8 $ 1,398.2
Net interest income – FTE 877.5 844.4 810.4 833.0 837.3 815.1 823.1 807.7
Per Common Share
Diluted $1.21 $ 1.18 $ 1.17 $ 1.17 $1.20 $ 1.20 $ 1.20 $ 1.06
Basic 1.23 1.19 1.19 1.18 1.21 1.21 1.22 1.07
Dividends declared 0.45 0.45 0.45 0.45 0.43 0.43 0.43 0.43
Book value 34.52 32.83 32.62 31.06 31.04 31.04 31.41 29.97
Market Price:
High 71.73 63.00 61.98 59.95 63.25 69.12 70.20 68.47
Low 60.45 58.00 51.44 51.73 51.48 55.90 65.10 58.32
Close 71.50 60.37 59.34 52.65 56.92 61.48 67.72 66.73
Selected Average Balances
Total assets $124,756.1 $126,701.8 $119,448.0 $118,276.2 $114,827.5 $107,845.9 $106,492.0 $104,796.1
Earning assets 112,729.5 112,328.6 106,606.4 105,249.0 101,895.5 95,562.2 94,740.5 93,198.1
Loans 79,370.1 77,733.2 74,311.5 73,049.8 72,668.8 71,695.6 70,985.1 69,694.6
Consumer and commercial deposits 70,312.6 70,851.5 69,097.1 67,466.7 67,829.7 66,141.3 65,466.3 62,211.5
Brokered and foreign deposits 10,769.6 10,521.1 10,707.2 10,379.9 7,329.4 4,956.7 5,179.8 5,432.4
Realized shareholders’ equity 7,932.4 7,710.4 7,413.7 7,323.1 7,204.8 7,095.9 6,901.5 6,729.8
Total shareholders’ equity 9,435.8 9,236.8 8,864.1 8,786.6 8,823.3 8,943.3 8,743.1 8,385.9
Common shares–diluted (thousands) 282,537 281,567 280,287 281,330 283,595 285,991 287,288 287,375
Common shares–basic (thousands) 278,852 278,296 277,397 278,631 280,364 282,310 283,293 284,055
Financial Ratios (Annualized)
Return on average total assets 1.09% 1.04% 1.11% 1.12% 1.18% 1.26% 1.29% 1.18%
Return on average assets less net
unrealized gains on securities 1.11 1.06 1.13 1.15 1.20 1.30 1.33 1.21
Return on average total
shareholders’ equity 14.40 14.24 14.95 15.13 15.30 15.22 15.77 14.74
Return on average realized
shareholders’ equity 17.13 17.06 17.87 18.16 18.74 19.18 19.97 18.37
Net interest margin 3.09 2.98 3.05 3.21 3.26 3.38 3.48 3.51
Reconcilement of Non-GAAP Measures
Return on average total assets 1.09% 1.04% 1.11% 1.12% 1.18% 1.26% 1.29% 1.18%
Impact of excluding net unrealized
securities gains 0.02 0.02 0.02 0.03 0.02 0.04 0.04 0.03
Return on average assets less net
unrealized gains on securities 1.11% 1.06% 1.13% 1.15% 1.20% 1.30% 1.33% 1.21%
Return on average total
shareholders’ equity 14.40% 14.24% 14.95% 15.13% 15.30% 15.22% 15.77% 14.74%
Impact of excluding net unrealized
securities gains 2.73 2.82 2.92 3.03 3.44 3.96 4.20 3.63
Return on average realized
shareholders’ equity 17.13% 17.06% 17.87% 18.16% 18.74% 19.18% 19.97% 18.37%
Net interest income $865.5 $ 832.8 $ 799.5 $ 822.5 $827.1 $ 805.1 $ 813.4 $ 798.1
FTE Adjustment 12.0 11.6 10.9 10.5 10.2 10.0 9.7 9.6
Net interest income–FTE $877.5 $ 844.4 $ 810.4 $ 833.0 $837.3 $ 815.1 $ 823.1 $ 807.7