SunTrust 2003 Annual Report Download - page 50
Download and view the complete annual report
Please find page 50 of the 2003 SunTrust annual report below. You can navigate through the pages in the report by either clicking on the pages listed below, or by using the keyword search tool below to find specific information within the annual report.-
 1
1 -
2
-
3
-
4
-
5
-
6
-
7
-
8
-
9
-
10
-
11
-
12
-
13
-
14
-
15
-
16
-
17
-
18
-
19
-
20
-
21
-
22
-
23
-
24
-
25
-
26
-
27
-
28
-
29
-
30
-
31
-
32
-
33
-
34
-
35
-
36
-
37
-
38
-
39
-
 40
40 -
 41
41 -
 42
42 -
 43
43 -
 44
44 -
 45
45 -
 46
46 -
 47
47 -
 48
48 -
 49
49 -
 50
50 -
 51
51 -
 52
52 -
 53
53 -
 54
54 -
 55
55 -
 56
56 -
 57
57 -
 58
58 -
 59
59 -
 60
60 -
61
-
62
-
63
-
64
-
65
-
66
-
67
-
68
-
69
-
70
-
71
-
72
-
73
-
74
-
75
-
76
-
77
-
78
-
79
-
80
-
81
-
82
-
83
-
84
-
85
-
86
-
87
-
88
-
89
-
90
-
91
-
92
-
93
-
94
-
95
-
96
-
97
-
98
-
99
-
100
-
101
-
102
-
103
-
104
 |
 |

48 SunTrust Banks, Inc. Annual Report 2003
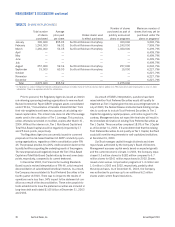
MANAGEMENT’S DISCUSSION continued
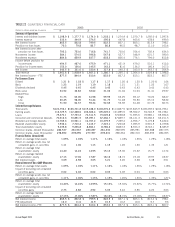
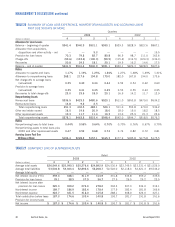
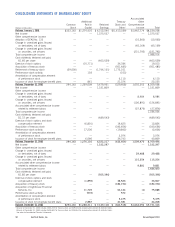
TABLE 26
SUMMARY OF LOAN LOSS EXPERIENCE, NONPERFORMING ASSETS AND ACCRUING LOANS
PAST DUE 90 DAYS OR MORE
Quarters
2003 2002
(Dollars in millions) 43214321
Allowance for Loan Losses
Balance – beginning of quarter $941.4 $940.9 $931.1 $930.1 $929.3 $928.9 $927.6 $867.1
Allowance from acquisitions,
dispositions and other activity – net ——9.3 — ———15.5
Provision for loan losses 70.3 79.8 82.7 80.8 96.5 98.7 111.0 163.6
Charge-offs (90.6) (103.6) (100.3) (99.9) (115.2) (114.5) (124.3) (136.1)
Recoveries 20.8 24.3 18.1 20.1 19.5 16.2 14.6 17.5
Balance – end of quarter $941.9 $941.4 $940.9 $931.1 $930.1 $929.3 $928.9 $927.6
Ratios
Allowance to quarter-end loans 1.17% 1.19% 1.25% 1.26% 1.27% 1.28% 1.29% 1.31%
Allowance to nonperforming loans 268.1 217.6 194.8 179.0 182.0 167.8 194.0 173.6
Net charge-offs to average loans
(annualized) 0.35 0.40 0.44 0.44 0.52 0.54 0.62 0.69
Provision to average loans
(annualized) 0.35 0.41 0.45 0.45 0.53 0.55 0.63 0.95
Recoveries to total charge-offs 23.0 23.5 18.0 20.1 16.9 14.2 11.7 12.9
Nonperforming Assets
Nonaccrual loans $336.5 $423.3 $480.6 $520.1 $511.0 $553.8 $479.0 $534.2
Restructured loans 14.8 9.2 2.5 — ————
Total nonperforming loans 351.3 432.5 483.1 520.1 511.0 553.8 479.0 534.2
Other real estate owned 16.5 19.6 20.9 18.0 18.0 15.0 18.2 18.5
Other repossessed assets 10.3 11.7 11.4 10.3 13.0 25.9 21.3 23.6
Total nonperforming assets $378.1 $463.8 $515.4 $548.4 $542.0 $594.7 $518.5 $576.3
Ratios
Nonperforming loans to total loans 0.44% 0.55% 0.64% 0.70% 0.70% 0.76% 0.67% 0.75%
Nonperforming assets to total loans plus
OREO and other repossessed assets 0.47 0.59 0.68 0.74 0.74 0.82 0.72 0.81
Accruing Loans Past Due
90 Days or More $196.4 $228.2 $157.1 $165.3 $177.9 $185.8 $175.8 $175.5
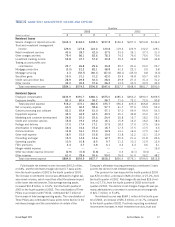
TABLE 27
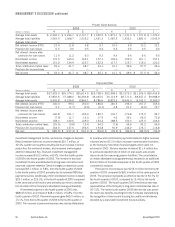
QUARTERLY LINE OF BUSINESS RESULTS
Retail
2003 2002
(Dollars in millions) 432143 21
Average total assets $26,549.6 $25,990.3 $25,276.6 $24,892.9 $24,530.4 $23,745.5 $23,331.4 $21,526.0
Average total liabilities 53,504.8 53,303.4 52,892.6 52,208.7 52,522.0 52,118.4 52,321.3 49,546.2
Average total equity ————————
Net interest income (FTE) 359.4 348.1 311.9 314.9 331.8 333.8 359.2 335.6
Provision for loan losses 39.1 38.9 37.9 36.7 27.5 26.5 25.2 23.5
Net interest income after
provision for loan losses 320.3 309.2 274.0 278.2 304.3 307.3 334.0 312.1
Noninterest income 189.7 186.9 183.4 178.4 177.5 182.4 181.8 166.6
Noninterest expense 322.7 321.5 318.0 315.8 288.1 308.0 324.0 327.1
Total contribution before taxes 187.3 174.6 139.4 140.8 193.7 181.7 191.8 151.6
Provision for income taxes ————————
Net income $187.3 $ 174.6 $ 139.4 $ 140.8 $193.7 $ 181.7 $ 191.8 $ 151.6