Rogers 2014 Annual Report Download - page 96
Download and view the complete annual report
Please find page 96 of the 2014 Rogers annual report below. You can navigate through the pages in the report by either clicking on the pages listed below, or by using the keyword search tool below to find specific information within the annual report.-
 1
1 -
2
-
3
-
4
-
5
-
6
-
7
-
8
-
9
-
10
-
11
-
12
-
13
-
14
-
15
-
16
-
17
-
18
-
19
-
20
-
21
-
22
-
23
-
24
-
25
-
26
-
27
-
28
-
29
-
30
-
31
-
32
-
33
-
34
-
35
-
36
-
37
-
38
-
39
-
40
-
41
-
42
-
43
-
44
-
45
-
46
-
47
-
48
-
49
-
50
-
51
-
52
-
53
-
54
-
55
-
56
-
57
-
58
-
59
-
60
-
61
-
62
-
63
-
64
-
65
-
66
-
67
-
68
-
69
-
70
-
71
-
72
-
73
-
74
-
75
-
76
-
77
-
78
-
79
-
80
-
81
-
82
-
83
-
84
-
85
-
 86
86 -
 87
87 -
 88
88 -
 89
89 -
 90
90 -
 91
91 -
 92
92 -
 93
93 -
 94
94 -
 95
95 -
 96
96 -
 97
97 -
 98
98 -
 99
99 -
 100
100 -
 101
101 -
 102
102 -
 103
103 -
 104
104 -
 105
105 -
 106
106 -
107
-
108
-
109
-
110
-
111
-
112
-
113
-
114
-
115
-
116
-
117
-
118
-
119
-
120
-
121
-
122
-
123
-
124
-
125
-
126
-
127
-
128
-
129
-
130
-
131
-
132
-
133
-
134
-
135
-
136
-
137
-
138
-
139
-
140
 |
 |

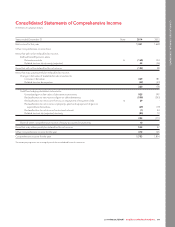
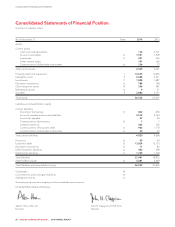
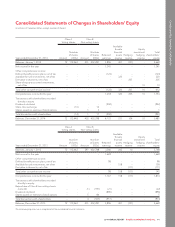
CONSOLIDATED FINANCIAL STATEMENTS
Consolidated Statements of Cash Flows
(In millions of Canadian dollars)
Years ended December 31 Note 2014 2013
Operating activities:
Net income for the year 1,341 1,669
Adjustments to reconcile net income to net cash flows from operating activities:
Depreciation and amortization 7, 8 2,144 1,898
Program rights amortization 866 52
Finance costs 10 817 742
Income taxes 12 506 596
Stock-based compensation 25 37 84
Gain on sale of TVtropolis 11 –(47)
Post-employment benefits contributions, net of expense 23 (34) (32)
Other 48 (14)
Cash provided by operating activities before changes in non-cash working capital,
income taxes paid and interest paid 4,925 4,948
Change in non-cash operating working capital items 30 11 238
Cash provided by operating activities before income taxes paid and interest paid 4,936 5,186
Income taxes paid (460) (496)
Interest paid (778) (700)
Cash provided by operating activities 3,698 3,990
Investing activities:
Additions to property, plant and equipment 7(2,366) (2,240)
Additions to program rights 8(231) (69)
Changes in non-cash working capital related to property, plant and equipment and
intangible assets 153 (114)
Acquisitions and strategic transactions, net of cash acquired 8, 26 (3,456) (1,080)
Proceeds on sale of TVtropolis 11 –59
Other (51) (29)
Cash used in investing activities (5,951) (3,473)
Financing activities:
Proceeds on settlement of cross-currency interest rate exchange agreements and
forward contracts 30 2,150 662
Payments on settlement of cross-currency interest rate exchange agreements and
forward contracts 30 (2,115) (1,029)
Proceeds received on short-term borrowings 19 276 650
Repayment of short-term borrowings 19 (84) –
Issuance of long-term debt 30 3,412 2,578
Repayment of long-term debt 30 (2,551) (356)
Transaction costs incurred (30) (37)
Repurchase of Class B Non-Voting shares 24 –(21)
Dividends paid (930) (876)
Cash provided by financing activities 128 1,571
Change in cash and cash equivalents (2,125) 2,088
Cash and cash equivalents, beginning of year 2,301 213
Cash and cash equivalents, end of year 176 2,301
Cash and cash equivalents is defined as cash and short-term deposits which have an original maturity of less than 90 days, less bank advances. As
at December 31, 2014 and 2013, the balance of cash and cash equivalents was comprised of cash and demand deposits.
The accompanying notes are an integral part of the consolidated financial statements.
92 ROGERS COMMUNICATIONS INC. 2014 ANNUAL REPORT