Rogers 2014 Annual Report Download - page 85
Download and view the complete annual report
Please find page 85 of the 2014 Rogers annual report below. You can navigate through the pages in the report by either clicking on the pages listed below, or by using the keyword search tool below to find specific information within the annual report.-
 1
1 -
2
-
3
-
4
-
5
-
6
-
7
-
8
-
9
-
10
-
11
-
12
-
13
-
14
-
15
-
16
-
17
-
18
-
19
-
20
-
21
-
22
-
23
-
24
-
25
-
26
-
27
-
28
-
29
-
30
-
31
-
32
-
33
-
34
-
35
-
36
-
37
-
38
-
39
-
40
-
41
-
42
-
43
-
44
-
45
-
46
-
47
-
48
-
49
-
50
-
51
-
52
-
53
-
54
-
55
-
56
-
57
-
58
-
59
-
60
-
61
-
62
-
63
-
64
-
65
-
66
-
67
-
68
-
69
-
70
-
71
-
72
-
73
-
74
-
 75
75 -
 76
76 -
 77
77 -
 78
78 -
 79
79 -
 80
80 -
 81
81 -
 82
82 -
 83
83 -
 84
84 -
 85
85 -
 86
86 -
 87
87 -
 88
88 -
 89
89 -
 90
90 -
 91
91 -
 92
92 -
 93
93 -
 94
94 -
 95
95 -
96
-
97
-
98
-
99
-
100
-
101
-
102
-
103
-
104
-
105
-
106
-
107
-
108
-
109
-
110
-
111
-
112
-
113
-
114
-
115
-
116
-
117
-
118
-
119
-
120
-
121
-
122
-
123
-
124
-
125
-
126
-
127
-
128
-
129
-
130
-
131
-
132
-
133
-
134
-
135
-
136
-
137
-
138
-
139
-
140
 |
 |

MANAGEMENT’S DISCUSSION AND ANALYSIS
We expect the application of this new standard will have significant
impacts on our reported results, specifically with regards to the timing
of recognition and classification of revenue, and the treatment of costs
incurred in obtaining customer contracts. We are assessing the impact
of this standard on our consolidated financial statements.
• IFRS 9, Financial Instruments (IFRS 9) – In July 2014, the IASB issued
the final publication of the IFRS 9 standard, superseding the current
IAS 39, Financial Instruments: recognition and measurement (IAS
39) standard. IFRS 9 includes revised guidance on the classification
and measurement of financial instruments, including a new
expected credit loss model for calculating impairment on financial
assets, and the new general hedge accounting requirements. It also
carries forward the guidance on recognition and derecognition of
financial instruments from IAS 39. The standard is effective for
annual periods beginning on or after January 1, 2018 with early
adoption permitted. We are assessing the impact of this standard
on our consolidated financial statements.
• Amendments to IAS 16, Property, Plant and Equipment and IAS 38,
Intangible Assets – In May 2014, the IASB issued amendments to
these standards to introduce a rebuttable presumption that the use
of revenue-based amortization methods for intangible assets is
inappropriate. The amendment is effective for annual periods
beginning on or after January 1, 2016 with early adoption
permitted. We are assessing the impact of this amendment on our
consolidated financial statements.
• Amendments to IFRS 11, Joint Arrangements – In May 2014, the
IASB issued an amendment to this standard requiring business
combination accounting to be applied to acquisitions of interests in
a joint operation that constitute a business. We are assessing the
impact of this amendment on our consolidated financial statements.
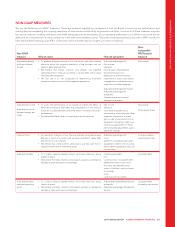
KEY PERFORMANCE INDICATORS
We measure the success of our strategy using a number of key
performance indicators, which are outlined below. We believe these
key performance indicators allow us to appropriately measure our
performance against our operating strategy as well as against the
results of our peers and competitors. The following key performance
indicators are not measurements in accordance with IFRS and should
not be considered as an alternative to net income or any other
measure of performance under IFRS.
SUBSCRIBER COUNT
We determine the number of subscribers to our services based on
active subscribers. When subscribers are deactivated, either voluntarily
or involuntarily for non-payment, they are considered to be
deactivations in the period the services are discontinued.
Wireless
• A wireless subscriber is represented by each identifiable telephone
number.
• We report wireless subscribers in two categories: postpaid and
prepaid. Postpaid and prepaid include voice-only subscribers, data-
only subscribers, and subscribers with service plans integrating both
voice and data.
• Wireless prepaid subscribers are considered active for a period of
180 days from the date of their last revenue-generating usage.
Cable
• Cable Television and Internet subscribers are represented by a
dwelling unit, and cable Phone subscribers are represented by line
counts.
• When there is more than one unit in one dwelling, like an apartment
building, each tenant with cable service is counted as an individual
subscriber, whether the service is invoiced separately or included in
the tenant’s rent. Institutional units, like hospitals or hotels, are each
considered to be one subscriber.
• Cable Television, Internet, and Phone subscribers include only those
subscribers who have service installed and operating, and who are
being billed accordingly.
SUBSCRIBER CHURN
Subscriber churn is a measure of the number of subscribers that
deactivated during a period as a percentage of the total subscriber
base, usually calculated on a monthly basis. Subscriber churn measures
our success in retaining our subscribers. We calculate it by dividing the
number of Wireless subscribers that deactivated (usually in a month) by
the aggregate numbers of subscribers at the beginning of the period.
When used or reported for a period greater than one month,
subscriber churn represents the sum of the number of subscribers
deactivating for each period incurred divided by the sum of the
aggregate number of subscribers at the beginning of each period
incurred.
AVERAGE REVENUE PER USER
Average revenue per user (ARPU) helps us identify trends and measure
our success in attracting and retaining higher value subscribers. We
calculate it by dividing revenue (usually monthly) by the average
number of subscribers in the period. For Wireless, ARPU is calculated
using network revenue. When used in connection with a particular type
of subscriber, ARPU is monthly revenue generated from those
subscribers, divided by the average number of those subscribers
during the month.
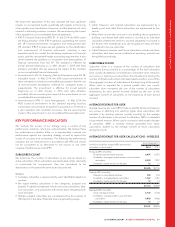
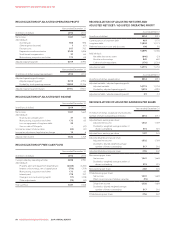
AVERAGE REVENUE PER USER CALCULATIONS – WIRELESS
(In millions of dollars, except ARPU and months;
subscribers in thousands)
As at December 31
2014 2013
Postpaid ARPU (monthly)
Postpaid (voice and data) revenue 6,495 6,470
Divided by: average postpaid wireless voice and data
subscribers 8,095 7,957
Divided by: twelve months for the year 12 12
$66.86 $67.76
Prepaid ARPU (monthly)
Prepaid (voice and data) revenue 248 278
Divided by: average prepaid subscribers 1,363 1,481
Divided by: twelve months for the year 12 12
$15.16 $15.64
Blended ARPU (monthly)
Voice and data revenue 6,743 6,748
Divided by: average wireless voice and data
subscribers 9,458 9,438
Divided by: twelve months for the year 12 12
$59.41 $59.58
2014 ANNUAL REPORT ROGERS COMMUNICATIONS INC. 81