Rogers 2014 Annual Report Download - page 119
Download and view the complete annual report
Please find page 119 of the 2014 Rogers annual report below. You can navigate through the pages in the report by either clicking on the pages listed below, or by using the keyword search tool below to find specific information within the annual report.-
 1
1 -
2
-
3
-
4
-
5
-
6
-
7
-
8
-
9
-
10
-
11
-
12
-
13
-
14
-
15
-
16
-
17
-
18
-
19
-
20
-
21
-
22
-
23
-
24
-
25
-
26
-
27
-
28
-
29
-
30
-
31
-
32
-
33
-
34
-
35
-
36
-
37
-
38
-
39
-
40
-
41
-
42
-
43
-
44
-
45
-
46
-
47
-
48
-
49
-
50
-
51
-
52
-
53
-
54
-
55
-
56
-
57
-
58
-
59
-
60
-
61
-
62
-
63
-
64
-
65
-
66
-
67
-
68
-
69
-
70
-
71
-
72
-
73
-
74
-
75
-
76
-
77
-
78
-
79
-
80
-
81
-
82
-
83
-
84
-
85
-
86
-
87
-
88
-
89
-
90
-
91
-
92
-
93
-
94
-
95
-
96
-
97
-
98
-
99
-
100
-
101
-
102
-
103
-
104
-
105
-
106
-
107
-
108
-
 109
109 -
 110
110 -
 111
111 -
 112
112 -
 113
113 -
 114
114 -
 115
115 -
 116
116 -
 117
117 -
 118
118 -
 119
119 -
 120
120 -
 121
121 -
 122
122 -
 123
123 -
 124
124 -
 125
125 -
 126
126 -
 127
127 -
 128
128 -
 129
129 -
130
-
131
-
132
-
133
-
134
-
135
-
136
-
137
-
138
-
139
-
140
 |
 |

NOTES TO CONSOLIDATED FINANCIAL STATEMENTS
FAIR VALUES OF FINANCIAL INSTRUMENTS
The carrying value of cash and cash equivalents, accounts receivable,
short-term borrowings, and accounts payable and accrued liabilities
approximate their fair values because of the short-term nature of these
financial instruments.
We determine the fair value of each of our publicly traded investments
using quoted market values. We determine the fair value of our private
investments by using implied valuations from follow-on financing
rounds, third party sale negotiations, or market-based approaches.
These are applied appropriately to each investment depending on its
future operating and profitability prospects.
The fair values of each of our public debt instruments are based on the
year-end estimated market yields. We determine the fair values of our
debt derivatives and expenditure derivatives using an estimated credit-
adjusted mark-to-market valuation by discounting cash flows to the
measurement date. In the case of debt derivatives and expenditure
derivatives in an asset position, the credit spread for the financial
institution counterparty is added to the risk-free discount rate to
determine the estimated credit-adjusted value for each derivative. For
these debt derivatives and expenditure derivatives in a liability
position, our credit spread is added to the risk-free discount rate for
each derivative.
The fair values of our equity derivatives are based on the quoted
market value of RCI’s Class B Non-Voting shares.
Fair value estimates are made at a specific point in time based on
relevant market information and information about the financial
instruments. The estimates are subjective in nature and involve
uncertainties and matters of judgement.
Our disclosure of the three-level fair value hierarchy reflects the
significance of the inputs used in measuring fair value:
• Financial assets and financial liabilities in Level 1 are valued by
referring to quoted prices in active markets for identical assets and
liabilities.
• Financial assets and financial liabilities in Level 2 are valued using
inputs based on observable market data, either directly or indirectly,
other than the quoted prices.
• Level 3 valuations are based on inputs that are not based on
observable market data.
There were no material financial instruments categorized in Level 3 as
at December 31, 2014 and 2013 and there were no transfers between
Level 1 and Level 2 during the respective periods.
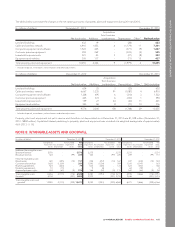
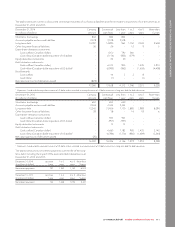
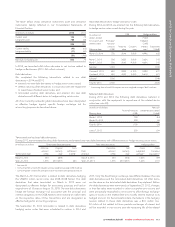
The table below shows the financial instruments carried at fair value by valuation method as at December 31, 2014 and 2013.
Carrying value Level 1 Level 2
(In millions of dollars) 2014 2013 2014 2013 2014 2013
Financial assets
Available-for-sale, measured at fair value:
Investments in publicly traded companies 1,130 809 1,130 809 ––
Held-for-trading:
Debt derivatives accounted for as cash flow hedges 853 184 ––853 184
Bond forwards accounted for as cash flow hedges 1–––1–
Expenditure derivatives accounted for as cash flow hedges 70 37 ––70 37
Total financial assets 2,054 1,030 1,130 809 924 221
Financial liabilities
Held-for-trading:
Debt derivatives accounted for as cash flow hedges 7133 ––7133
Bond forwards accounted for as cash flow hedges 14 –––14 –
Equity derivatives not accounted for as cash flow hedges 30 13 ––30 13
Total financial liabilities 51 146 ––51 146
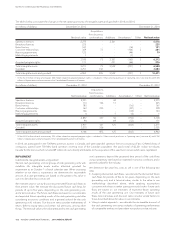
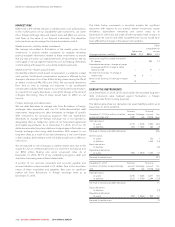
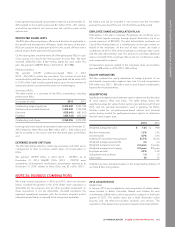
The fair value of our long-term debt as at December 31 is estimated as follows:
(In millions of dollars) 2014 2013
Carrying
amount
Fair
value 1
Carrying
amount
Fair
value 1
Long-term debt (including current portion) 14,787 16,584 13,343 14,463
1Long-term debt (including current portion) is measured at level 2 in the three-level fair value hierarchy, based on year-end trading values.
We did not have any non-derivative held-to-maturity financial assets during the years ended December 31, 2014 and 2013.
2014 ANNUAL REPORT ROGERS COMMUNICATIONS INC. 115