Rogers 2014 Annual Report Download - page 55
Download and view the complete annual report
Please find page 55 of the 2014 Rogers annual report below. You can navigate through the pages in the report by either clicking on the pages listed below, or by using the keyword search tool below to find specific information within the annual report.-
 1
1 -
2
-
3
-
4
-
5
-
6
-
7
-
8
-
9
-
10
-
11
-
12
-
13
-
14
-
15
-
16
-
17
-
18
-
19
-
20
-
21
-
22
-
23
-
24
-
25
-
26
-
27
-
28
-
29
-
30
-
31
-
32
-
33
-
34
-
35
-
36
-
37
-
38
-
39
-
40
-
41
-
42
-
43
-
44
-
 45
45 -
 46
46 -
 47
47 -
 48
48 -
 49
49 -
 50
50 -
 51
51 -
 52
52 -
 53
53 -
 54
54 -
 55
55 -
 56
56 -
 57
57 -
 58
58 -
 59
59 -
 60
60 -
 61
61 -
 62
62 -
 63
63 -
 64
64 -
 65
65 -
66
-
67
-
68
-
69
-
70
-
71
-
72
-
73
-
74
-
75
-
76
-
77
-
78
-
79
-
80
-
81
-
82
-
83
-
84
-
85
-
86
-
87
-
88
-
89
-
90
-
91
-
92
-
93
-
94
-
95
-
96
-
97
-
98
-
99
-
100
-
101
-
102
-
103
-
104
-
105
-
106
-
107
-
108
-
109
-
110
-
111
-
112
-
113
-
114
-
115
-
116
-
117
-
118
-
119
-
120
-
121
-
122
-
123
-
124
-
125
-
126
-
127
-
128
-
129
-
130
-
131
-
132
-
133
-
134
-
135
-
136
-
137
-
138
-
139
-
140
 |
 |

MANAGEMENT’S DISCUSSION AND ANALYSIS
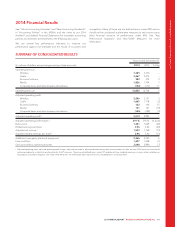
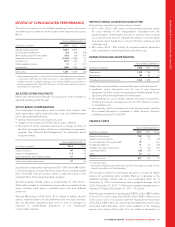
REVIEW OF CONSOLIDATED PERFORMANCE
This section discusses our consolidated operating income, net income
and other expenses that do not form part of the segment discussions
above.
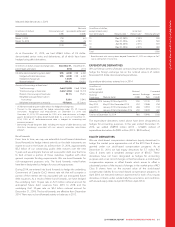
Years ended December 31
(In millions of dollars) 2014 2013 % Chg
Adjusted operating profit 15,019 4,993 1
Stock-based compensation (37) (84) (56)
Restructuring, acquisition and other (173) (85) 104
Depreciation and amortization (2,144) (1,898) 13
Finance costs (817) (742) 10
Other (expense) income (1) 81 (101)
Income taxes (506) (596) (15)
Net income 1,341 1,669 (20)
1Adjusted operating profit is a non-GAAP measure and should not be considered as
a substitute or alternative for GAAP measures. It is not a defined term under IFRS
and does not have a standard meaning, so may not be a reliable way to compare us
to other companies. See “Non-GAAP Measures” for information about this measure,
including how we calculate it.
ADJUSTED OPERATING PROFIT
Please see “2014 Financial Results” for a discussion of the increase in
adjusted operating profit this year.
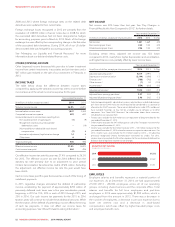
STOCK-BASED COMPENSATION
Our stock-based compensation, which includes stock options (with
stock appreciation rights), restricted share units, and deferred share
units is generally determined by:
• vesting of stock options and share units; and
• changes in the market price of RCI Class B shares; offset by
• the impact of certain derivative instruments to hedge a portion of
the stock price appreciation risk for our stock-based compensation
program. See “Financial Risk Management” for information about
equity derivatives.
Years ended December 31
(In millions of dollars) 2014 2013
Impact of vesting 44 42
Impact of change in price (17) 34
Equity derivatives, net of interest receipt 10 8
Total stock-based compensation 37 84
Stock-based compensation decreased to $37 million from $84 million
in 2013 primarily as a result of the 2013 impact from increased market
price of the RCI Class B common shares in early 2013 prior to the
implementation of the equity derivatives program.
We had a liability of $144 million as at December 31, 2014 (2013 –
$164 million) related to stock-based compensation recorded at its fair
value, including stock options, restricted share units and deferred
share units.
We paid $48 million in 2014 (2013 – $101 million) to holders of stock
options, restricted share units and deferred share units upon exercise.
We use derivative instruments from time to time to manage our
exposure to market-based fluctuations in our stock-based
compensation expense.
RESTRUCTURING, ACQUISITION AND OTHER
Restructuring, acquisition and other mainly included:
• $131 million (2013 – $53 million) of restructuring expenses mainly
for costs relating to the reorganization associated with the
implementation of the Rogers 3.0 plan to structure teams around
our customers and remove management layers to increase agility
and ensure senior leadership is closer to front-line employees and
customers; and
• $42 million (2013 – $32 million) of acquisition-related transaction
costs, provisions for certain legal claims and other costs.
DEPRECIATION AND AMORTIZATION
Years ended December 31
(In millions of dollars) 2014 2013 % Chg
Depreciation 1,979 1,748 13
Amortization 165 150 10
Total depreciation and amortization 2,144 1,898 13
Depreciation and amortization increased this year mainly because of:
• significant recent investment and roll out of new customer
equipment at Cable, mostly next generation NextBox digital TV set-
top boxes which are depreciated over three years;
• the availability for use of certain network and system investments,
including the launch and expansion of our LTE network in various
municipalities; and
• new property, plant and equipment and intangible assets resulting
from several acquisitions completed in Cable, Business Solutions
and Media during 2013 and 2014.
FINANCE COSTS
Years ended December 31
(In millions of dollars) 2014 2013 % Chg
Interest on borrowings 1782 734 7
Interest on pension liability 714 (50)
Loss on repayment of long-term debt 29 —n/m
Foreign exchange loss 11 23 (52)
Change in fair value of derivatives 2(16) n/m
Capitalized interest (26) (25) 4
Other 12 12 —
Total finance costs 817 742 10
n/m: not meaningful.
1Borrowings include long-term debt and short-term borrowings associated with our
accounts receivable securitization program.
The increase in interest on borrowings this year is a result of a higher
amount of outstanding debt, partially offset by a decrease in the
weighted average interest rate on our outstanding debt. As at
December 31, 2014, our borrowings had a weighted average cost of
5.20% (December 31, 2013 – 5.54%) and a weighted average term to
maturity of 10.8 years (December 31, 2013 – 10.3 years).
Early this year, we repaid or repurchased US$750 million ($834 million)
of our 6.375% senior notes and US$350 million ($387 million) of our
5.50% senior notes. In conjunction with the repayment or repurchase
of this debt, a $29 million loss was recognized pertaining to previously
terminated debt derivatives which were deferred in the hedging
reserve until maturity of the notes. This loss relates to transactions in
2014 ANNUAL REPORT ROGERS COMMUNICATIONS INC. 51