Rogers 2014 Annual Report Download - page 48
Download and view the complete annual report
Please find page 48 of the 2014 Rogers annual report below. You can navigate through the pages in the report by either clicking on the pages listed below, or by using the keyword search tool below to find specific information within the annual report.-
 1
1 -
2
-
3
-
4
-
5
-
6
-
7
-
8
-
9
-
10
-
11
-
12
-
13
-
14
-
15
-
16
-
17
-
18
-
19
-
20
-
21
-
22
-
23
-
24
-
25
-
26
-
27
-
28
-
29
-
30
-
31
-
32
-
33
-
34
-
35
-
36
-
37
-
 38
38 -
 39
39 -
 40
40 -
 41
41 -
 42
42 -
 43
43 -
 44
44 -
 45
45 -
 46
46 -
 47
47 -
 48
48 -
 49
49 -
 50
50 -
 51
51 -
 52
52 -
 53
53 -
 54
54 -
 55
55 -
 56
56 -
 57
57 -
 58
58 -
59
-
60
-
61
-
62
-
63
-
64
-
65
-
66
-
67
-
68
-
69
-
70
-
71
-
72
-
73
-
74
-
75
-
76
-
77
-
78
-
79
-
80
-
81
-
82
-
83
-
84
-
85
-
86
-
87
-
88
-
89
-
90
-
91
-
92
-
93
-
94
-
95
-
96
-
97
-
98
-
99
-
100
-
101
-
102
-
103
-
104
-
105
-
106
-
107
-
108
-
109
-
110
-
111
-
112
-
113
-
114
-
115
-
116
-
117
-
118
-
119
-
120
-
121
-
122
-
123
-
124
-
125
-
126
-
127
-
128
-
129
-
130
-
131
-
132
-
133
-
134
-
135
-
136
-
137
-
138
-
139
-
140
 |
 |

MANAGEMENT’S DISCUSSION AND ANALYSIS
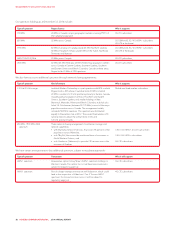
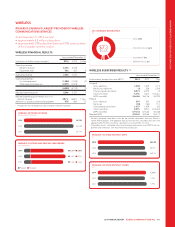
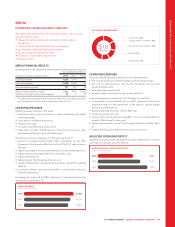
OPERATING REVENUE
Our operating revenue depends on the size of our subscriber base,
the revenue per user and revenue from wireless devices, and other
equipment sales.
Network revenue
Network revenue includes revenue derived from voice and data
servicesfrompostpaidmonthlyfees,airtime,datausage,longdistance
charges, optional service charges, inbound and outbound roaming
charges and certain fees, as well as prepaid usage for airtime, data and
other ancillary charges such as long distance.
Network revenue was consistent this year as a result of:
• continued adoption of the customer-friendly Rogers Share
Everything Plans, which generate higher ARPU and bundle in certain
calling features and long distance, grant the ability to pool data
usage with other devices on the same account, and entice
customers with access to our other products, such as Roam Like
Home and Rogers NHL GameCentre LIVE; and
• higher usage of wireless data services; offset by
• lower roaming revenue due to the introduction over the past year of
US and international roaming pricing and plans which provide
greater value to our customers.
Blended ARPU decreased this year primarily due to the relatively
unchanged network revenue described above and a slight increase in
average number of wireless subscribers over the course of the year.
Excluding the decline in roaming revenue, network revenue would have
increased by 2% and postpaid ARPU would have increased by 1%.
The increase in churn and volatility in net additions to our postpaid
subscriber base this year were expected in the short-term as we
implement our Rogers 3.0 plan and our strategic focus towards
optimizing subscriber value versus subscriber volumes, as well as
migrating existing customers to current pricing plans. During the latter
portion of the year, we implemented a number of commercial policies
which, amongst other things, adjusted the entry price levels for
customers to be eligible for subsidized premium devices and
eliminated eligibility for device subsidies for a number of previously
discounted offerings. Furthermore, we believe that the industry
transition from three year to two year plans as a result of the adoption
of the CRTC Wireless Code may have also slowed overall wireless
subscriber growth during the year. See “Regulation in Our Industry” for
more information on the Wireless Code.
We activated and upgraded approximately 2.6 million smartphones for
new and existing subscribers this year, compared to approximately
2.7 million in 2013. The decrease was due to a 1% decrease in
hardware upgrades and a 12% reduction in gross additions.
The percentage of subscribers with smartphones at the end of the year
was 84% of our total postpaid subscriber base, compared to 75% at
the end of 2013. In our experience, smartphone subscribers typically
generate significantly higher ARPU and are less likely to churn than
customers on less advanced devices. Effective October 1, 2014,
customers with smartphones in our Bring Your Own Device (BYOD)
program are included in our smartphone subscriber measures, which
also contributed to the increase in smartphone penetration.
Data revenue increased by 10% this year primarily because of the
continued penetration and growing use of smartphones, tablet
devices and wireless laptops, which are increasing the use of e-mail,
Internet access, social media, mobile video, text messaging and other
wireless data services. Data revenue exceeded voice revenue for the
first time and represented approximately 52% of total network revenue
this year, compared to approximately 47% last year.
(%)
SMARTPHONES AS A PERCENTAGE OF POSTPAID SUBSCRIBERS
2014
2013
2012
84%
75%
69%
Thedecreaseinprepaidsubscribers was mainly because of increasing
competition at the lower end of the wireless market where prepaid
products are mainly sold as we continue to increase our focus away
from subscriber volume towards the higher lifetime value segment of
the market.
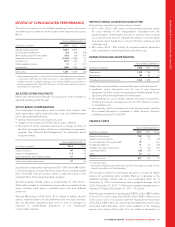
(IN MILLIONS OF DOLLARS)
WIRELESS DATA REVENUE
2014
2013
2012
$3,484
$3,175
$2,722
(%)
DATA REVENUE AS A PERCENTAGE OF NETWORK REVENUE
2014
2013
2012
52%
47%
41%
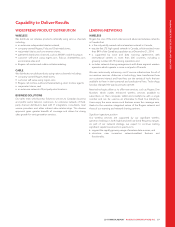
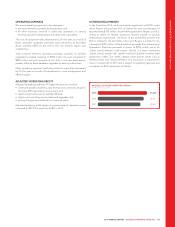
Equipment sales
Equipment sales (net of subsidies) include revenue from sales to:
• independent dealers, agents and retailers; and
• directly to subscribers through fulfillment by Wireless’ customer
service groups, websites, telesales and corporate stores.
The 8% increase in revenue from equipment sales this year primarily
reflects decreased subsidies we provide as a result of the industry
transition from three to two year plans and a shift in the sales mix of
smartphones. During this year, we activated 12% more iPhones in
comparison to the prior year, which corresponded with the launch of
the iPhone 6 in the latter portion of 2014. This was partially offset by
fewer existing subscriber upgrades and the lower number of gross
activations. Overall, the percentage of customers choosing to upgrade
their wireless devices throughout the year represented approximately
23% of our year end postpaid subscriber base, which is consistent with
the prior year.
44 ROGERS COMMUNICATIONS INC. 2014 ANNUAL REPORT