Rogers 2014 Annual Report Download - page 108
Download and view the complete annual report
Please find page 108 of the 2014 Rogers annual report below. You can navigate through the pages in the report by either clicking on the pages listed below, or by using the keyword search tool below to find specific information within the annual report.-
 1
1 -
2
-
3
-
4
-
5
-
6
-
7
-
8
-
9
-
10
-
11
-
12
-
13
-
14
-
15
-
16
-
17
-
18
-
19
-
20
-
21
-
22
-
23
-
24
-
25
-
26
-
27
-
28
-
29
-
30
-
31
-
32
-
33
-
34
-
35
-
36
-
37
-
38
-
39
-
40
-
41
-
42
-
43
-
44
-
45
-
46
-
47
-
48
-
49
-
50
-
51
-
52
-
53
-
54
-
55
-
56
-
57
-
58
-
59
-
60
-
61
-
62
-
63
-
64
-
65
-
66
-
67
-
68
-
69
-
70
-
71
-
72
-
73
-
74
-
75
-
76
-
77
-
78
-
79
-
80
-
81
-
82
-
83
-
84
-
85
-
86
-
87
-
88
-
89
-
90
-
91
-
92
-
93
-
94
-
95
-
96
-
97
-
 98
98 -
 99
99 -
 100
100 -
 101
101 -
 102
102 -
 103
103 -
 104
104 -
 105
105 -
 106
106 -
 107
107 -
 108
108 -
 109
109 -
 110
110 -
 111
111 -
 112
112 -
 113
113 -
 114
114 -
 115
115 -
 116
116 -
 117
117 -
 118
118 -
119
-
120
-
121
-
122
-
123
-
124
-
125
-
126
-
127
-
128
-
129
-
130
-
131
-
132
-
133
-
134
-
135
-
136
-
137
-
138
-
139
-
140
 |
 |
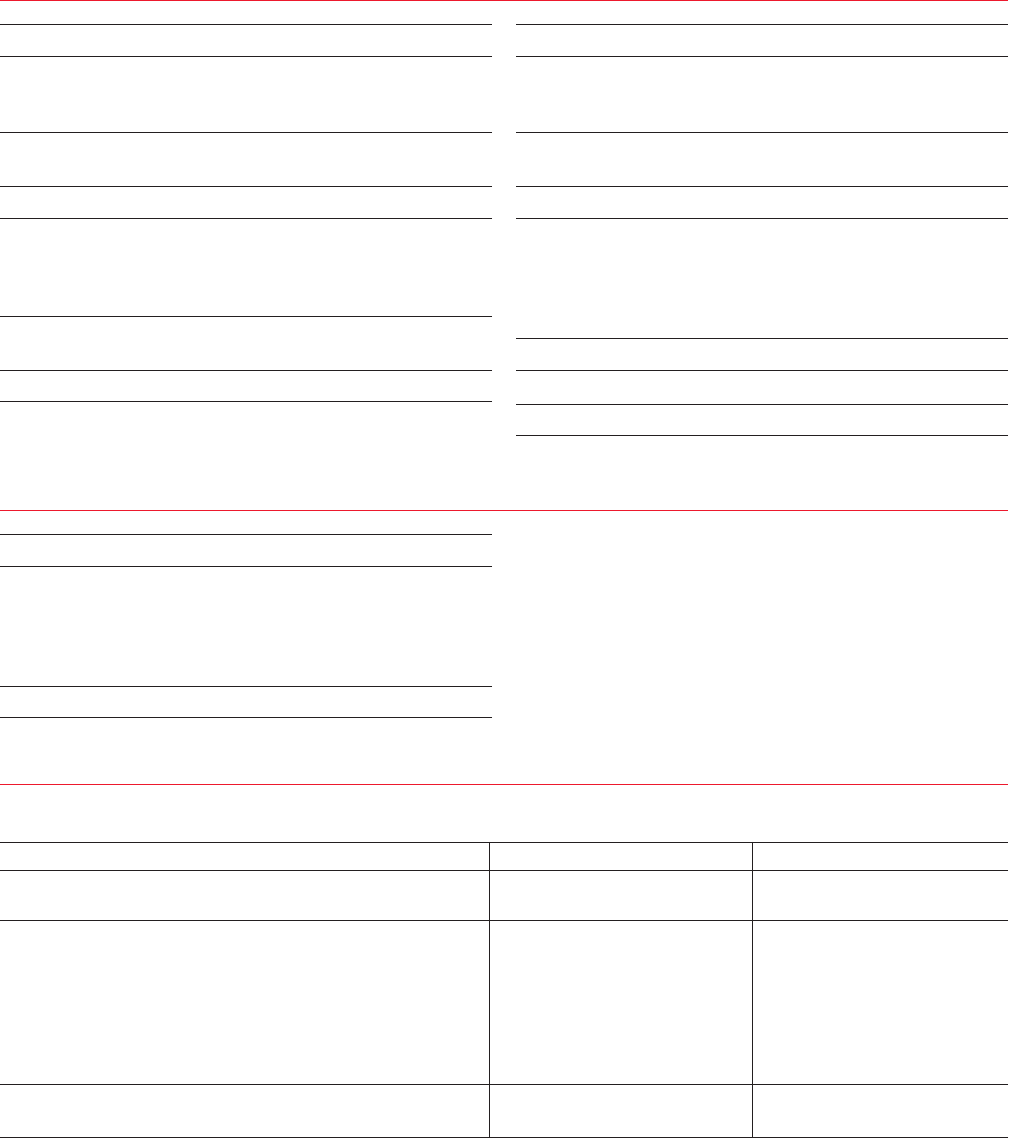
NOTES TO CONSOLIDATED FINANCIAL STATEMENTS
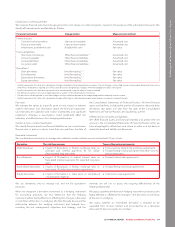
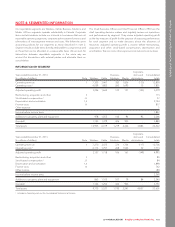
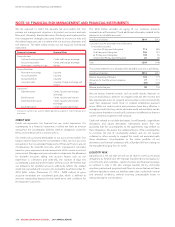
NOTE 5: OPERATING REVENUE
(In millions of dollars) 2014 2013
Wireless:
Postpaid 6,495 6,470
Prepaid 248 278
Network revenue 6,743 6,748
Equipment sales 562 522
Total Wireless 7,305 7,270
Cable:
Internet 1,245 1,159
Television 1,734 1,809
Phone 478 498
Service revenue 3,457 3,466
Equipment sales 10 9
Total Cable 3,467 3,475
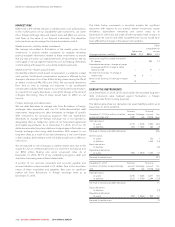
(In millions of dollars) 2014 2013
Business Solutions:
Next generation 271 213
Legacy 106 149
Service revenue 377 362
Equipment sales 512
Total Business Solutions 382 374
Media:
Advertising 775 762
Subscription 382 316
Retail 314 305
Other 355 321
Total Media 1,826 1,704
Corporate items and intercompany eliminations (130) (117)
Total operating revenue 12,850 12,706
NOTE 6: OPERATING COSTS
(In millions of dollars) 2014 2013
Cost of equipment sales and direct channel subsidies 1,493 1,541
Merchandise for resale 206 190
Other external purchases 4,229 4,126
Employee salaries and benefits and stock-based
compensation 1,940 1,940
Total operating costs 7,868 7,797
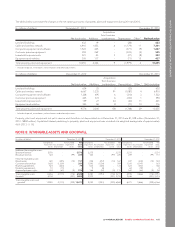
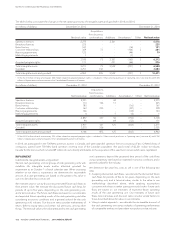
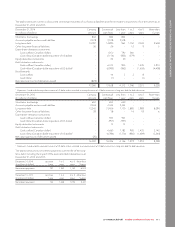
NOTE 7: PROPERTY, PLANT AND EQUIPMENT
The table below shows property, plant and equipment and accumulated depreciation as at December 31, 2014, 2013 and 2012.
(In millions of dollars) December 31, 2014 December 31, 2013 December 31, 2012
Cost
Accumulated
depreciation
Net book
value Cost
Accumulated
depreciation
Net book
value Cost
Accumulated
depreciation
Net book
value
Land and buildings 942 (319) 623 923 (291) 632 894 (260) 634
Cable and wireless network 19,588 (12,387) 7,201 18,197 (11,287) 6,910 16,805 (10,138) 6,667
Computer equipment and
software 4,960 (3,353) 1,607 4,553 (3,031) 1,522 3,972 (2,644) 1,328
Customer premise equipment 1,543 (988) 555 2,009 (1,415) 594 1,764 (1,319) 445
Leasehold improvements 383 (151) 232 492 (271) 221 407 (248) 159
Equipment and vehicles 1,236 (799) 437 1,124 (748) 376 1,055 (712) 343
Total property, plant and
equipment 28,652 (17,997) 10,655 27,298 (17,043) 10,255 24,897 (15,321) 9,576
104 ROGERS COMMUNICATIONS INC. 2014 ANNUAL REPORT