Rogers 2014 Annual Report Download - page 63
Download and view the complete annual report
Please find page 63 of the 2014 Rogers annual report below. You can navigate through the pages in the report by either clicking on the pages listed below, or by using the keyword search tool below to find specific information within the annual report.-
 1
1 -
2
-
3
-
4
-
5
-
6
-
7
-
8
-
9
-
10
-
11
-
12
-
13
-
14
-
15
-
16
-
17
-
18
-
19
-
20
-
21
-
22
-
23
-
24
-
25
-
26
-
27
-
28
-
29
-
30
-
31
-
32
-
33
-
34
-
35
-
36
-
37
-
38
-
39
-
40
-
41
-
42
-
43
-
44
-
45
-
46
-
47
-
48
-
49
-
50
-
51
-
52
-
 53
53 -
 54
54 -
 55
55 -
 56
56 -
 57
57 -
 58
58 -
 59
59 -
 60
60 -
 61
61 -
 62
62 -
 63
63 -
 64
64 -
 65
65 -
 66
66 -
 67
67 -
 68
68 -
 69
69 -
 70
70 -
 71
71 -
 72
72 -
 73
73 -
74
-
75
-
76
-
77
-
78
-
79
-
80
-
81
-
82
-
83
-
84
-
85
-
86
-
87
-
88
-
89
-
90
-
91
-
92
-
93
-
94
-
95
-
96
-
97
-
98
-
99
-
100
-
101
-
102
-
103
-
104
-
105
-
106
-
107
-
108
-
109
-
110
-
111
-
112
-
113
-
114
-
115
-
116
-
117
-
118
-
119
-
120
-
121
-
122
-
123
-
124
-
125
-
126
-
127
-
128
-
129
-
130
-
131
-
132
-
133
-
134
-
135
-
136
-
137
-
138
-
139
-
140
 |
 |

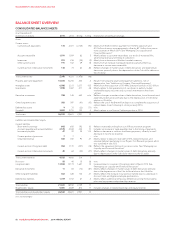
MANAGEMENT’S DISCUSSION AND ANALYSIS
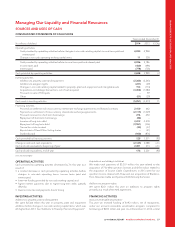
March 2016. In March 2014, we issued $1.25 billion of debt securities
under the Canadian Shelf and US$750 million ($832 million) of debt
securities under the US Shelf. See “Senior note issuances” above for
more information.
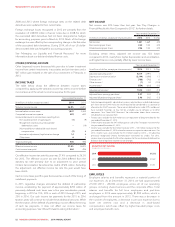
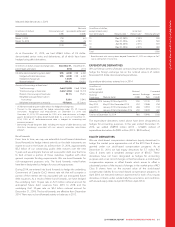
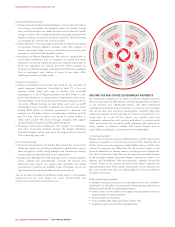
FREE CASH FLOW
Years ended December 31
(In millions of dollars) 2014 2013 % Chg
Adjusted operating profit 15,019 4,993 1
Property, plant and equipment expenditures 2(2,366) (2,240) 6
Interest on borrowings, net of capitalization (756) (709) 7
Cash income taxes (460) (496) (7)
Free cash flow 11,437 1,548 (7)
1Adjusted operating profit and free cash flow are non-GAAP measures and should
not be considered as a substitute or alternative for GAAP measures. They are not
defined terms under IFRS, and do not have standard meanings, so may not be a
reliable way to compare us to other companies. See “Non-GAAP Measures” for
information about these measures, including how we calculate them.
2Includes additions to property, plant and equipment expenditures and excludes
purchases of spectrum licences.
Free cash flow decreased by 7% this year as a result of higher property,
plant and equipment expenditures, and higher interest on our
borrowings (net of capitalization) as a result of increased outstanding
long-term debt, partially offset by higher adjusted operating profit and
lower cash income taxes.
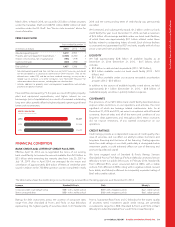
(IN MILLIONS OF DOLLARS)
FREE CASH FLOW
2014
2013
2012
$1,437
$1,548
$1,649
FINANCIAL CONDITION
BANK CREDIT AND LETTER OF CREDIT FACILITIES
Effective April 16, 2014, we re-negotiated the terms of our existing
bank credit facility to increase the amount available from $2.0 billion to
$2.5 billion while extending the maturity date from July 20, 2017 to
July 19, 2019. Also in April 2014, we arranged for the return and
cancellation of approximately $0.4 billion of letters of credit that were
issued in relation to the 700 MHz spectrum auction completed in early
2014 and the corresponding letter of credit facility was permanently
cancelled.
We borrowed, and subsequently repaid, $1.3 billion under our bank
credit facility this year. As at December 31, 2014, we had a maximum
of $2.6 billion of borrowings available under our bank credit facilities,
of which there was approximately $0.1 billion utilized under these
facilities related to outstanding letters of credit. Each of these facilities
is unsecured and guaranteed by RCP and ranks equally with all of our
senior unsecured notes and debentures.
LIQUIDITY
We had approximately $2.8 billion of available liquidity as at
December 31, 2014 (December 31, 2013 – $4.5 billion), which
includes:
• $0.2 billion in cash and cash equivalents (2013 – $2.3 billion);
• $2.5 billion available under our bank credit facility (2013 – $2.0
billion); and
• $0.1 billion available under our accounts receivable securitization
program (2013 – $0.2 billion).
In addition to the sources of available liquidity noted above, we held
approximately $1.1 billion (December 31, 2013 – $0.8 billion) of
marketable equity securities in publicly traded companies.
COVENANTS
The provisions of our $2.5 billion bank credit facility described above
impose certain restrictions on our operations and activities, the most
significant of which are leverage related maintenance tests. As at
December 31, 2014 and 2013, we were in compliance with all financial
covenants, financial ratios and all of the terms and conditions of our
long-term debt agreements and, throughout 2014, these covenants
did not impose restrictions of any material consequence on our
operations.
CREDIT RATINGS
Credit ratings provide an independent measure of credit quality of an
issue of securities, and can affect our ability to obtain short-term and
long-term financing and the terms of the financing. If rating agencies
lower the credit ratings on our debt, particularly a downgrade below
investment grade, it could adversely affect our cost of financing and
access to liquidity and capital.
We have engaged each of Standard & Poor’s Ratings Services
(Standard & Poor’s), Fitch Ratings (Fitch) and Moody’s Investors Service
(Moody’s) to rate our public debt issues. In February 2014, Standard &
Poor’s affirmed RCI’s senior unsecured debt at BBB+ with a stable
outlook, Fitch affirmed its BBB+ rating with a negative outlook, revised
from stable, and Moody’s affirmed its comparably equivalent rating of
Baa1 with a stable outlook.
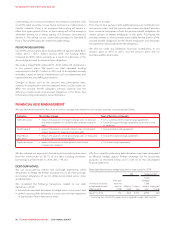
The table below shows the credit ratings on our borrowings received from the rating agencies as at December 31, 2014:
Issuance Standard & Poor’s Fitch Moody’s
Corporate credit issuer default rating BBB+ with a stable outlook BBB+ with a negative outlook Baa1, stable outlook
Senior unsecured debt BBB+ with a stable outlook BBB+ with a negative outlook Baa1, stable outlook
Ratings for debt instruments across the universe of composite rates
range from AAA (Standard & Poor’s and Fitch) or Aaa (Moody’s)
representing the highest quality of securities rated, to D (Standard &
Poor’s), Substantial Risk (Fitch), and C (Moody’s) for the lowest quality
of securities rated. Investment grade credit ratings are generally
considered to range from BBB- (Standard & Poor’s and Fitch) or Baa3
(Moody’s) to AAA (Standard & Poor’s and Fitch) or Aaa (Moody’s).
2014 ANNUAL REPORT ROGERS COMMUNICATIONS INC. 59