Rogers 2014 Annual Report Download - page 115
Download and view the complete annual report
Please find page 115 of the 2014 Rogers annual report below. You can navigate through the pages in the report by either clicking on the pages listed below, or by using the keyword search tool below to find specific information within the annual report.-
 1
1 -
2
-
3
-
4
-
5
-
6
-
7
-
8
-
9
-
10
-
11
-
12
-
13
-
14
-
15
-
16
-
17
-
18
-
19
-
20
-
21
-
22
-
23
-
24
-
25
-
26
-
27
-
28
-
29
-
30
-
31
-
32
-
33
-
34
-
35
-
36
-
37
-
38
-
39
-
40
-
41
-
42
-
43
-
44
-
45
-
46
-
47
-
48
-
49
-
50
-
51
-
52
-
53
-
54
-
55
-
56
-
57
-
58
-
59
-
60
-
61
-
62
-
63
-
64
-
65
-
66
-
67
-
68
-
69
-
70
-
71
-
72
-
73
-
74
-
75
-
76
-
77
-
78
-
79
-
80
-
81
-
82
-
83
-
84
-
85
-
86
-
87
-
88
-
89
-
90
-
91
-
92
-
93
-
94
-
95
-
96
-
97
-
98
-
99
-
100
-
101
-
102
-
103
-
104
-
 105
105 -
 106
106 -
 107
107 -
 108
108 -
 109
109 -
 110
110 -
 111
111 -
 112
112 -
 113
113 -
 114
114 -
 115
115 -
 116
116 -
 117
117 -
 118
118 -
 119
119 -
 120
120 -
 121
121 -
 122
122 -
 123
123 -
 124
124 -
 125
125 -
126
-
127
-
128
-
129
-
130
-
131
-
132
-
133
-
134
-
135
-
136
-
137
-
138
-
139
-
140
 |
 |
NOTES TO CONSOLIDATED FINANCIAL STATEMENTS
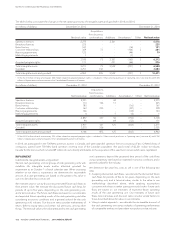
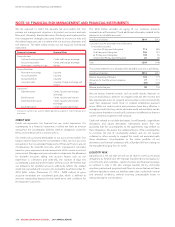
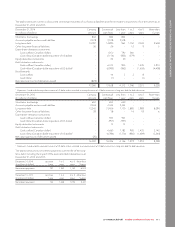
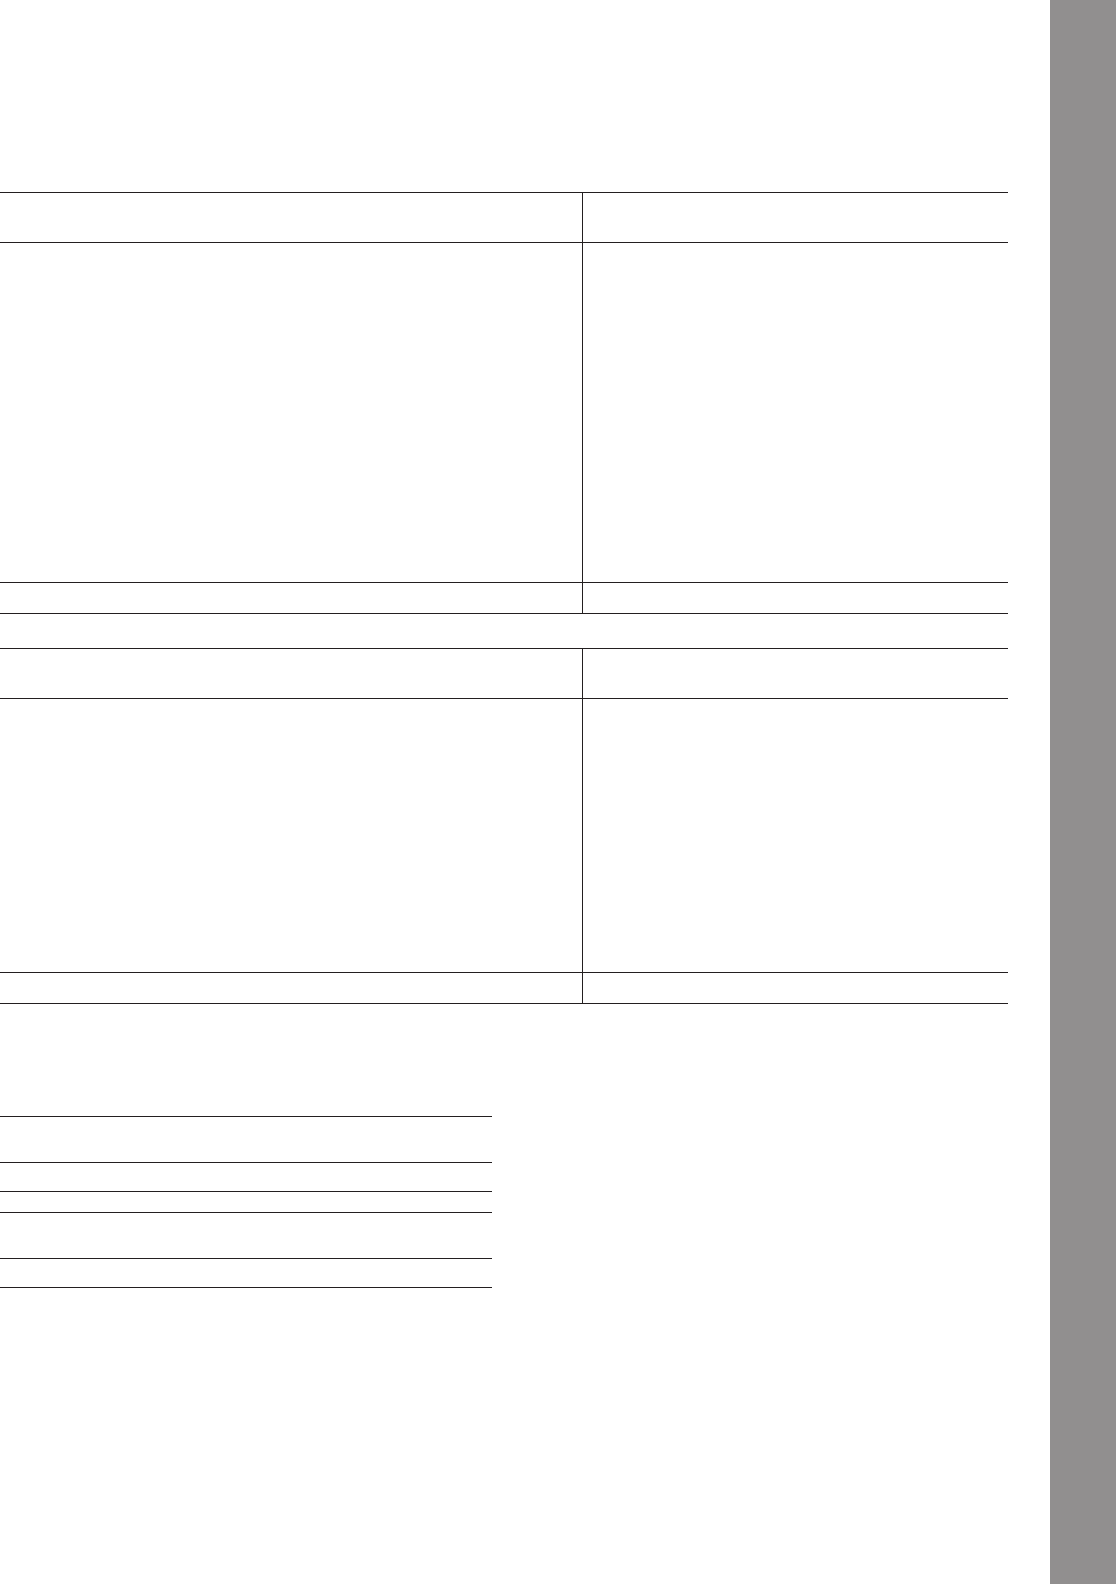
The tables below set out the undiscounted contractual maturities of our financial liabilities and the receivable components of our derivatives as at
December 31, 2014 and 2013.
December 31, 2014
(In millions of dollars)
Carrying
amount
Contractual
cash flows
Less than
1year
1to3
years
4to5
years
More than
5years
Short-term borrowings 842 842 842 – – –
Accounts payable and accrued liabilities 2,578 2,578 2,578 – – –
Long-term debt 14,787 14,895 963 1,750 2,524 9,658
Other long-term financial liabilities 26 26 – 12 9 5
Expenditure derivative instruments:
Cash outflow (Canadian dollar) – 1,050 790 260 – –
Cash inflow (Canadian dollar equivalent of US dollar) – (1,114) (835) (279) – –
Equity derivative instruments – 30 30 – – –
Debt derivative instruments:
Cash outflow (Canadian dollar) – 6,313 905 – 1,435 3,973
Cash inflow (Canadian dollarequivalentofUSdollar)1– (6,995) (963) – (1,624) (4,408)
Bond forwards:
Cash outflow – 14 3 3 8 –
Cash inflow – (1) – – (1) –
Net carrying amount of derivatives (asset) (873)
17,360 17,638 4,313 1,746 2,351 9,228
1Represents Canadian dollar equivalent amount of US dollar inflows matched to an equal amount of US dollar maturities in long-term debt for debt derivatives.
December 31, 2013
(In millions of dollars)
Carrying
amount
Contractual
cash flows
Less than
1year
1to3
years
4to5
years
More than
5years
Short-term borrowings 650 650 650 – – –
Accounts payable and accrued liabilities 2,344 2,344 2,344 – – –
Long-term debt 13,343 13,436 1,170 1,883 1,989 8,394
Other long-term financial liabilities 38 38 – 14 18 6
Expenditure derivative instruments:
Cash outflow (Canadian dollar) – 923 923 – – –
Cash inflow (Canadian dollar equivalent of US dollar) – (957) (957) – – –
Equity derivative instruments – 13 13 – – –
Debt derivative instruments:
Cash outflow (Canadian dollar) – 6,665 1,183 905 1,435 3,142
Cash inflow (Canadian dollarequivalentofUSdollar)1– (6,786) (1,170) (883) (1,489) (3,244)
Net carrying amount of derivatives (asset) (75)
16,300 16,326 4,156 1,919 1,953 8,298
1Represents Canadian dollar equivalent amount of US dollar inflows matched to an equal amount of US dollar maturities in long-term debt for debt derivatives.
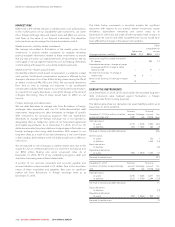
The tables below show net interest payments over the life of the long-
term debt, including the impact of the associated debt derivatives as at
December 31, 2014 and 2013:
December 31, 2014
(In millions of dollars)
Less than
1year
1to3
years
4to5
years
More than
5years
Net interest payments 757 1,343 1,143 6,022
December 31, 2013
(In millions of dollars)
Less than
1year
1to3
years
4to5
years
More than
5years
Net interest payments 743 1,258 1,093 5,341
2014 ANNUAL REPORT ROGERS COMMUNICATIONS INC. 111