Rogers 2014 Annual Report Download - page 53
Download and view the complete annual report
Please find page 53 of the 2014 Rogers annual report below. You can navigate through the pages in the report by either clicking on the pages listed below, or by using the keyword search tool below to find specific information within the annual report.-
 1
1 -
2
-
3
-
4
-
5
-
6
-
7
-
8
-
9
-
10
-
11
-
12
-
13
-
14
-
15
-
16
-
17
-
18
-
19
-
20
-
21
-
22
-
23
-
24
-
25
-
26
-
27
-
28
-
29
-
30
-
31
-
32
-
33
-
34
-
35
-
36
-
37
-
38
-
39
-
40
-
41
-
42
-
 43
43 -
 44
44 -
 45
45 -
 46
46 -
 47
47 -
 48
48 -
 49
49 -
 50
50 -
 51
51 -
 52
52 -
 53
53 -
 54
54 -
 55
55 -
 56
56 -
 57
57 -
 58
58 -
 59
59 -
 60
60 -
 61
61 -
 62
62 -
 63
63 -
64
-
65
-
66
-
67
-
68
-
69
-
70
-
71
-
72
-
73
-
74
-
75
-
76
-
77
-
78
-
79
-
80
-
81
-
82
-
83
-
84
-
85
-
86
-
87
-
88
-
89
-
90
-
91
-
92
-
93
-
94
-
95
-
96
-
97
-
98
-
99
-
100
-
101
-
102
-
103
-
104
-
105
-
106
-
107
-
108
-
109
-
110
-
111
-
112
-
113
-
114
-
115
-
116
-
117
-
118
-
119
-
120
-
121
-
122
-
123
-
124
-
125
-
126
-
127
-
128
-
129
-
130
-
131
-
132
-
133
-
134
-
135
-
136
-
137
-
138
-
139
-
140
 |
 |

MANAGEMENT’S DISCUSSION AND ANALYSIS
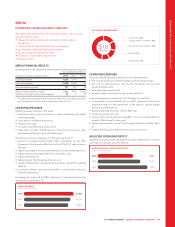
MEDIA
DIVERSIFIED CANADIAN MEDIA COMPANY
We have a broad portfolio of media properties, which most
significantly includes:
• category-leading television and radio broadcasting
properties
• multi-platform televised and online shopping
• publishing including Next Issue Canada
• sports media and entertainment
• exclusive 12-year NHL Agreement
• digital media.
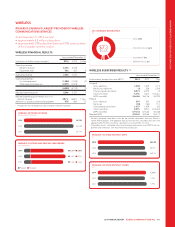
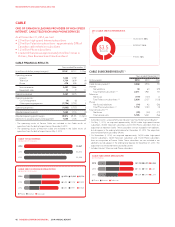
MEDIA FINANCIAL RESULTS
Years ended December 31
(In millions of dollars, except margins) 2014 2013 1%Chg
Operating revenue 1,826 1,704 7
Operating expenses (1,695) (1,543) 10
Adjusted operating profit 131 161 (19)
Adjusted operating profit margin 7.2% 9.4% (2.2 pts)
Additions to property, plant and equipment 94 79 19
1The operating results of Sportsnet 360 (formerly theScore) are included in the Media
results of operations from the date of acquisition on April 30, 2013.
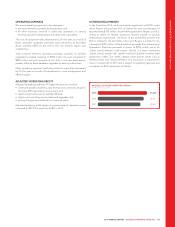
OPERATING REVENUE
Media generates revenue in five areas:
• advertising sales across its television,radio,publishinganddigital
media properties;
• subscriptions to televised products;
• retail product sales;
• circulation of published products; and
• ticket sales, receipts of MLB revenue sharing and concession sales
associated with Rogers Sports Entertainment.
Operating revenue increased by 7% this year as a result of:
• revenues of approximately $100 million generated by the NHL
Agreement that became effective for the 2014-2015 season late in
the year;
• higher subscription revenue generated by our Sportsnet properties;
• higher revenue associated with the Toronto Blue Jays;
• higher radio revenue;
• higher sales at The Shopping Channel; and
• growth of Next Issue Canada (which launched in late 2013); partially
offset by
• continued softness and structural shifts in conventional television
and print advertising.
Excluding the impact of the NHL Agreement, total revenue this year
would have increased by 1%.
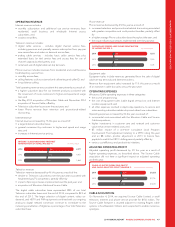
(IN MILLIONS OF DOLLARS)
MEDIA REVENUE
2014
2013
2012
$1,826
$1,704
$1,620
(%)
2014 MEDIA REVENUE MIX
TELEVISION 47%
THE SHOPPING CHANNEL 16%
RADIO 13%
PUBLISHING 11%
SPORTS ENTERTAINMENT 13%
$1.8
BILLION
OPERATING EXPENSES
We assess Media operating expenses in four general areas:
• the cost of broadcast content (including sports programming);
• the cost of retail products sold by The Shopping Channel and
Sports Entertainment;
• Blue Jays player payroll; and
• all other expenses involved in day-to-day operations.
Operating expenses increased by 10% this year as a result of:
• incremental costs associated with the NHL Agreement which are
expensed based on the proportion of the season’s games played
during a specified period;
• higherplayersalariesattheTorontoBlueJays;
• higher programming costs;
• incremental costs of approximately $16 million associated with the
growth of Next Issue Canada; and
• higher merchandise costs at The Shopping Channel; partially offset
by
• lower publishing costs related to the lower print volume.
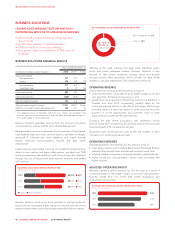
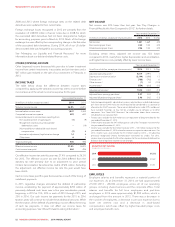
ADJUSTED OPERATING PROFIT
Adjusted operating profit decreased this year, reflecting the revenue
and expense changes described above.
(IN MILLIONS OF DOLLARS)
MEDIA ADJUSTED OPERATING PROFIT
2014
2013
2012
$131
$161
$190
2014 ANNUAL REPORT ROGERS COMMUNICATIONS INC. 49