Rogers 2014 Annual Report Download - page 110
Download and view the complete annual report
Please find page 110 of the 2014 Rogers annual report below. You can navigate through the pages in the report by either clicking on the pages listed below, or by using the keyword search tool below to find specific information within the annual report.-
 1
1 -
2
-
3
-
4
-
5
-
6
-
7
-
8
-
9
-
10
-
11
-
12
-
13
-
14
-
15
-
16
-
17
-
18
-
19
-
20
-
21
-
22
-
23
-
24
-
25
-
26
-
27
-
28
-
29
-
30
-
31
-
32
-
33
-
34
-
35
-
36
-
37
-
38
-
39
-
40
-
41
-
42
-
43
-
44
-
45
-
46
-
47
-
48
-
49
-
50
-
51
-
52
-
53
-
54
-
55
-
56
-
57
-
58
-
59
-
60
-
61
-
62
-
63
-
64
-
65
-
66
-
67
-
68
-
69
-
70
-
71
-
72
-
73
-
74
-
75
-
76
-
77
-
78
-
79
-
80
-
81
-
82
-
83
-
84
-
85
-
86
-
87
-
88
-
89
-
90
-
91
-
92
-
93
-
94
-
95
-
96
-
97
-
98
-
99
-
 100
100 -
 101
101 -
 102
102 -
 103
103 -
 104
104 -
 105
105 -
 106
106 -
 107
107 -
 108
108 -
 109
109 -
 110
110 -
 111
111 -
 112
112 -
 113
113 -
 114
114 -
 115
115 -
 116
116 -
 117
117 -
 118
118 -
 119
119 -
 120
120 -
121
-
122
-
123
-
124
-
125
-
126
-
127
-
128
-
129
-
130
-
131
-
132
-
133
-
134
-
135
-
136
-
137
-
138
-
139
-
140
 |
 |

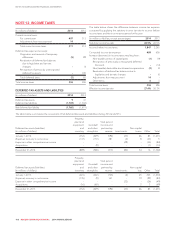
NOTES TO CONSOLIDATED FINANCIAL STATEMENTS
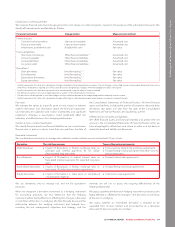
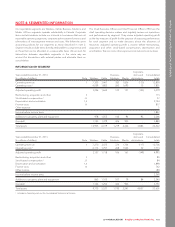
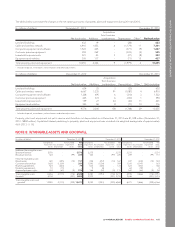
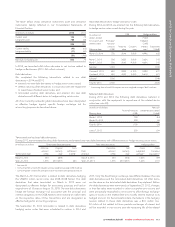
The tables below summarize the changes in the net carrying amounts of intangible assets and goodwill in 2014 and 2013.
(In millions of dollars) December 31, 2013 December 31, 2014
Net book value
Acquisitions
from business
combinations Additions Amortization 1Other Net book value
Spectrum licences 2,275 – 3,301 – – 5,576
Broadcast licences 225 – – – – 225
Brand names 167 – – (16) – 151
Customer relationships 309 73 – (104) 3 281
Roaming agreements 123 – – (44) – 79
Marketing agreements 1 – – (1) – –
3,100 73 3,301 (165) 3 6,312
Acquired program rights 111 – 231 (66) – 276
Total intangible assets 3,211 73 3,532 (231) 3 6,588
Goodwill 3,751 132 – – – 3,883
Total intangible assets and goodwill 6,962 205 3,532 (231) 3 10,471
1Of the $231 million of total amortization, $66 million related to acquired program rights is included in Other external purchases in Operating costs (seenote6),and$165
million in Depreciation and amortization in the Consolidated Statements of Income.
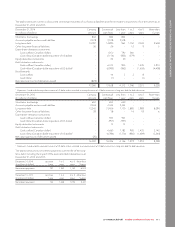
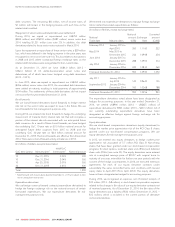
(In millions of dollars) December 31, 2012 December 31, 2013
Net book value
Acquisitions
from business
combinations Additions Amortization 1Other Net book value
Spectrum licences 2,231 – 44 – – 2,275
Broadcast licences 110 104 11 – – 225
Brand names 183 – – (16) – 167
Customer relationships 163 233 – (87) – 309
Roaming agreements 166 – – (43) – 123
Marketing agreements 4 – 1 (4) – 1
2,857 337 56 (150) – 3,100
Acquired program rights 94 – 69 (52) – 111
Total intangible assets 2,951 337 125 (202) – 3,211
Goodwill 3,215 536 – – – 3,751
Total intangible assets and goodwill 6,166 873 125 (202) – 6,962
1Of the $202 million of total amortization, $52 million related to acquired program rights is included in Other external purchases in Operating costs (seenote6),and$150
million in Depreciation and amortization in the Consolidated Statements of Income.
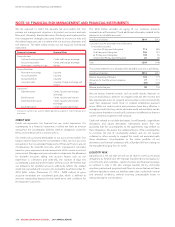
In 2014, we participated in the 700 MHz spectrum auction in Canada, and were awarded spectrum licences consisting of two 12 MHz blocks of
contiguous, paired lower 700 MHz band spectrum covering most of the Canadian population. We paid a total of $3,301 million to Industry
Canada for the licence which included $9 million of costs directly attributable to the acquisition of the spectrum licences which were capitalized.
IMPAIRMENT
Indefinite life intangible assets and goodwill
We test cash generating units or groups of cash generating units with
indefinite life intangible assets and/or allocated goodwill for
impairment as at October 1 of each calendar year. When assessing
whether or not there is impairment, we determine the recoverable
amount of a cash generating unit based on the greater of its value in
use or its fair value less costs to sell.
We estimate value in use by discounting estimated future cash flows to
their present value. We estimate the discounted future cash flows for
periods of up to five years, depending on the cash generating unit,
and a terminal value. The future cash flows are based on our estimates
and expected future operating results of the cash generating unit after
considering economic conditions and a general outlook for the cash
generating unit’s industry. Our discount rates consider market rates of
return, debt to equity ratios and certain risk premiums, among other
things. The terminal value is the value attributed to the cash generating
unit’s operations beyond the projected time period of the cash flows
using a perpetuity rate based on expected economic conditions and a
general outlook for the industry.
We determine fair value less costs to sell in one of the following two
ways:
• Analyzing discounted cash flows – we estimate the discounted future
cash flows for periods of five to ten years, depending on the cash
generating unit, and a terminal value, similar to the value in use
methodology described above, while applying assumptions
consistent with those a market participant would make. Future cash
flows are based on our estimates of expected future operating
results of the cash generating unit. Our estimates of future cash
flows, terminal values and discount rates consider similar factors to
those described above for value in use estimates.
• Using a market approach – we estimate the recoverable amount of
the cash generating unit using multiples of operating performance
of comparable entities and precedent transactions in that industry.
106 ROGERS COMMUNICATIONS INC. 2014 ANNUAL REPORT