Rogers 2014 Annual Report Download - page 126
Download and view the complete annual report
Please find page 126 of the 2014 Rogers annual report below. You can navigate through the pages in the report by either clicking on the pages listed below, or by using the keyword search tool below to find specific information within the annual report.-
 1
1 -
2
-
3
-
4
-
5
-
6
-
7
-
8
-
9
-
10
-
11
-
12
-
13
-
14
-
15
-
16
-
17
-
18
-
19
-
20
-
21
-
22
-
23
-
24
-
25
-
26
-
27
-
28
-
29
-
30
-
31
-
32
-
33
-
34
-
35
-
36
-
37
-
38
-
39
-
40
-
41
-
42
-
43
-
44
-
45
-
46
-
47
-
48
-
49
-
50
-
51
-
52
-
53
-
54
-
55
-
56
-
57
-
58
-
59
-
60
-
61
-
62
-
63
-
64
-
65
-
66
-
67
-
68
-
69
-
70
-
71
-
72
-
73
-
74
-
75
-
76
-
77
-
78
-
79
-
80
-
81
-
82
-
83
-
84
-
85
-
86
-
87
-
88
-
89
-
90
-
91
-
92
-
93
-
94
-
95
-
96
-
97
-
98
-
99
-
100
-
101
-
102
-
103
-
104
-
105
-
106
-
107
-
108
-
109
-
110
-
111
-
112
-
113
-
114
-
115
-
 116
116 -
 117
117 -
 118
118 -
 119
119 -
 120
120 -
 121
121 -
 122
122 -
 123
123 -
 124
124 -
 125
125 -
 126
126 -
 127
127 -
 128
128 -
 129
129 -
 130
130 -
 131
131 -
 132
132 -
 133
133 -
 134
134 -
 135
135 -
 136
136 -
137
-
138
-
139
-
140
 |
 |

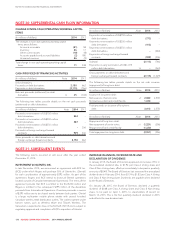
NOTES TO CONSOLIDATED FINANCIAL STATEMENTS
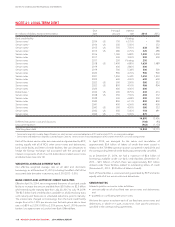
Certain subsidiaries have defined contribution plans with total pension
expense of $2 million in 2014 (2013 — $2 million), which is included in
employee salaries and benefits expense.
ASSUMPTIONS
There are significant assumptions that are used in the calculations
provided by our actuaries, and it is the responsibility of management
to determine which assumptions could result in a significant impact
when determining the accrued benefit obligations and pension
expense.
Principal actuarial assumptions
2014 2013
Weighted average of
significant assumptions:
Defined benefit obligation
Discount rate 4.1% 5.1%
Rate of compensation
increase 3.0% 3.0%
Mortality rate CIA Private
with CPM B Scale
CIA Private
with CPM A Scale
Pension expense
Discount rate 5.1% 4.5%
Rate of compensation
increase 3.0% 3.0%
Mortality rate CIA Private
with CPM A Scale
UP94
Generational
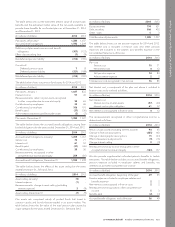
Sensitivity of key assumptions
In the sensitivity analysis shown below, we determine the defined
benefitobligationusingthesamemethodusedtocalculatethe
defined benefit obligation we recognize in the Consolidated
Statements of Financial Position. We calculate sensitivity by changing
one assumption while holding the others constant. This leads to
limitations in the analysis as the actual change in defined benefit
obligation will likely be different from that shown in the table, since it is
likely that more than one assumption will change at a time, and that
some assumptions are correlated.
Increase (decrease)
in accrued benefit
obligation
Increase (decrease)
in pension
expense
(In millions of dollars) 2014 2013 2014 2013
Discount rate
Impact of 0.5% increase (141) (105) (15) (11)
Impact of 0.5% decrease 162 120 16 13
Rate of future compensation
increase
Impact of 0.25% increase
18 14 33
Impact of 0.25% decrease (18) (14) (3) (2)
Mortality rate
Impact of 1 year increase 35 26 34
Impact of 1 year decrease (36) (27) (3) (3)
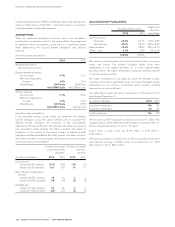
ALLOCATION OF PLAN ASSETS
Allocation of plan assets Target asset
allocation
percentage2014 2013
Equity securities:
Domestic 20.3% 20.1% 10% to 29%
International 40.0% 40.7% 29% to 48%
Debt securities 39.4% 38.9% 38% to 47%
Other — cash 0.3% 0.3% 0% to 2%
100.0% 100.0%
Plan assets consist primarily of pooled funds that invest in common
stocks and bonds. The pooled Canadian equity funds have
investments in our equity securities. As a result, approximately
$3 million (2013 — $3 million) of the plans’ assets are indirectly invested
in our own equity securities.
We make contributions to the plans to secure the benefits of plan
members and invest in permitted investments using the target ranges
established by our Pension Committee, which reviews actuarial
assumptions on an annual basis.
The table below shows the actual contributions to the plans for the
years ended December 31:
(In millions of dollars) 2014 2013
Employer contribution 106 101
Employee contribution 30 26
Total contribution 136 127
We estimate our 2015 employer contributions to be $117 million. The
average duration of the defined benefit obligation as at December 31,
2014 is 20 years (December 31, 2013 — 19 years).
Actual return on plan assets was $149 million in 2014 (2013 –
$102 million).
We have recognized a cumulative lossinothercomprehensiveincome
and retained earnings of $324 million as at December 31, 2014
(December 31, 2013 – $201 million).
122 ROGERS COMMUNICATIONS INC. 2014 ANNUAL REPORT