Rogers 2014 Annual Report Download - page 113
Download and view the complete annual report
Please find page 113 of the 2014 Rogers annual report below. You can navigate through the pages in the report by either clicking on the pages listed below, or by using the keyword search tool below to find specific information within the annual report.-
 1
1 -
2
-
3
-
4
-
5
-
6
-
7
-
8
-
9
-
10
-
11
-
12
-
13
-
14
-
15
-
16
-
17
-
18
-
19
-
20
-
21
-
22
-
23
-
24
-
25
-
26
-
27
-
28
-
29
-
30
-
31
-
32
-
33
-
34
-
35
-
36
-
37
-
38
-
39
-
40
-
41
-
42
-
43
-
44
-
45
-
46
-
47
-
48
-
49
-
50
-
51
-
52
-
53
-
54
-
55
-
56
-
57
-
58
-
59
-
60
-
61
-
62
-
63
-
64
-
65
-
66
-
67
-
68
-
69
-
70
-
71
-
72
-
73
-
74
-
75
-
76
-
77
-
78
-
79
-
80
-
81
-
82
-
83
-
84
-
85
-
86
-
87
-
88
-
89
-
90
-
91
-
92
-
93
-
94
-
95
-
96
-
97
-
98
-
99
-
100
-
101
-
102
-
 103
103 -
 104
104 -
 105
105 -
 106
106 -
 107
107 -
 108
108 -
 109
109 -
 110
110 -
 111
111 -
 112
112 -
 113
113 -
 114
114 -
 115
115 -
 116
116 -
 117
117 -
 118
118 -
 119
119 -
 120
120 -
 121
121 -
 122
122 -
 123
123 -
124
-
125
-
126
-
127
-
128
-
129
-
130
-
131
-
132
-
133
-
134
-
135
-
136
-
137
-
138
-
139
-
140
 |
 |

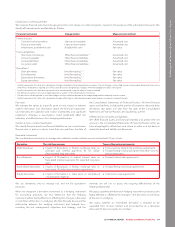
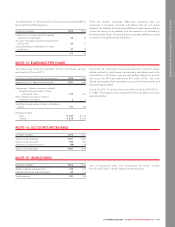
NOTES TO CONSOLIDATED FINANCIAL STATEMENTS
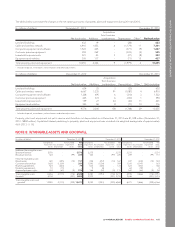
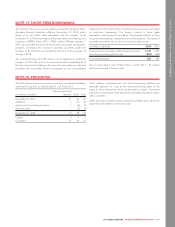
As at December 31, 2014 and 2013, we had not recognized deferred
tax assets for the following items.
(In millions of dollars) 2014 2013
Capital losses in Canada that can be applied
against future capital gains 56 43
Tax losses in foreign jurisdictions that expire from
2023 to 2033 20 17
Deductible temporary differences in foreign
jurisdictions 37 32
113 92
There are taxable temporary differences associated with our
investment in Canadian domestic subsidiaries. We do not record
deferred tax liabilities for temporary differences when we are able to
control the timing of the reversal, and the reversal is not probable in
the foreseeable future. Reversing these temporary differences would
not result in any significant tax implications.
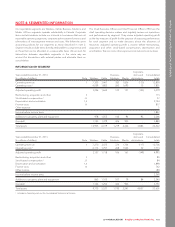
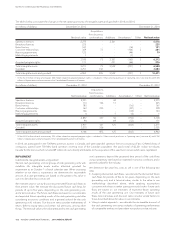
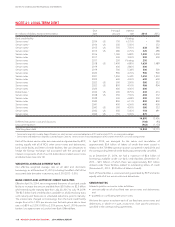
NOTE 13: EARNINGS PER SHARE
The table below shows the calculation of basic and diluted earnings
per share for 2014 and 2013.
(In millions of dollars, except per share amounts) 2014 2013
Numerator (basic) – Net income for the year 1,341 1,669
Denominator – Number of shares (in millions):
Weighted average number of shares
outstanding – basic 515 515
Effect of dilutive securities (in millions):
Employee stock options 23
Weighted average number of shares outstanding –
diluted 517 518
Earnings per share
Basic $ 2.60 $3.24
Diluted $ 2.56 $3.22
Accounting for outstanding share-based payments using the equity-
settled method for stock-based compensation was determined to be
more dilutive in 2014 than using the cash-settled method. As a result,
net income for 2014 was reduced by $15 million (2013 – nil) in the
diluted earnings per share calculation to account for these awards as if
they were equity-settled.
A total of 1,257,117 options were out of the money for 2014 (2013 –
577,584). These options were excluded from the calculation since they
were anti-dilutive.
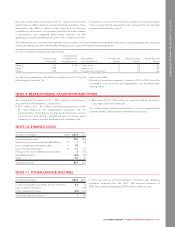
NOTE 14: ACCOUNTS RECEIVABLE
(In millions of dollars) 2014 2013
Trade accounts receivable 1,307 1,252
Other accounts receivable 382 361
Allowance for doubtful accounts (98) (104)
Total accounts receivable 1,591 1,509
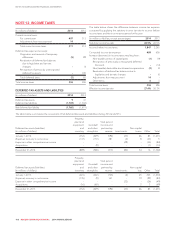
NOTE 15: INVENTORIES
(In millions of dollars) 2014 2013
Wireless handsets and accessories 189 213
Other finished goods and merchandise 62 63
Total inventories 251 276
Cost of equipment sales and merchandise for resale includes
$1,615 million (2013 – $1,667 million) of inventory costs.
2014 ANNUAL REPORT ROGERS COMMUNICATIONS INC. 109