Rogers 2014 Annual Report Download - page 31
Download and view the complete annual report
Please find page 31 of the 2014 Rogers annual report below. You can navigate through the pages in the report by either clicking on the pages listed below, or by using the keyword search tool below to find specific information within the annual report.-
 1
1 -
2
-
3
-
4
-
5
-
6
-
7
-
8
-
9
-
10
-
11
-
12
-
13
-
14
-
15
-
16
-
17
-
18
-
19
-
20
-
 21
21 -
 22
22 -
 23
23 -
 24
24 -
 25
25 -
 26
26 -
 27
27 -
 28
28 -
 29
29 -
 30
30 -
 31
31 -
 32
32 -
 33
33 -
 34
34 -
 35
35 -
 36
36 -
 37
37 -
 38
38 -
 39
39 -
 40
40 -
 41
41 -
42
-
43
-
44
-
45
-
46
-
47
-
48
-
49
-
50
-
51
-
52
-
53
-
54
-
55
-
56
-
57
-
58
-
59
-
60
-
61
-
62
-
63
-
64
-
65
-
66
-
67
-
68
-
69
-
70
-
71
-
72
-
73
-
74
-
75
-
76
-
77
-
78
-
79
-
80
-
81
-
82
-
83
-
84
-
85
-
86
-
87
-
88
-
89
-
90
-
91
-
92
-
93
-
94
-
95
-
96
-
97
-
98
-
99
-
100
-
101
-
102
-
103
-
104
-
105
-
106
-
107
-
108
-
109
-
110
-
111
-
112
-
113
-
114
-
115
-
116
-
117
-
118
-
119
-
120
-
121
-
122
-
123
-
124
-
125
-
126
-
127
-
128
-
129
-
130
-
131
-
132
-
133
-
134
-
135
-
136
-
137
-
138
-
139
-
140
 |
 |

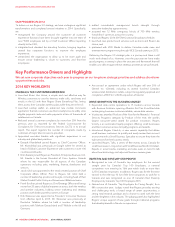
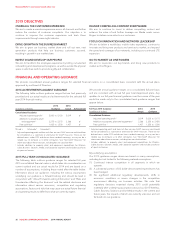
MANAGEMENT’S DISCUSSION AND ANALYSIS
2014 HIGHLIGHTS
KEY FINANCIAL INFORMATION
Years ended December 31
(In millions of dollars, except margins and per share amounts) 2014 2013 % Chg
Consolidated
Operating revenue 12,850 12,706 1
As adjusted 1:
Operating profit 5,019 4,993 1
Operating profit margin 39.1% 39.3% (0.2 pts)
Net income 1,532 1,769 (13)
Diluted earnings per share $ 2.96 $ 3.42 (13)
Net income 1,341 1,669 (20)
Basic earnings per share $ 2.60 $ 3.24 (20)
Diluted earnings per share $ 2.56 $ 3.22 (20)
Cash provided by operating activities 3,698 3,990 (7)
Free cash flow 11,437 1,548 (7)
Wireless
Operating revenue 7,305 7,270 –
Adjusted operating profit 3,246 3,157 3
Adjusted operating profit margin as a % of network revenue 48.1% 46.8% 1.3 pts
Cable
Operating revenue 3,467 3,475 –
Adjusted operating profit 1,665 1,718 (3)
Adjusted operating profit margin 48.0% 49.4% (1.4 pts)
Business Solutions
Operating revenue 382 374 2
Adjusted operating profit 122 106 15
Media
Operating revenue 1,826 1,704 7
Adjusted operating profit 131 161 (19)
KEY PERFORMANCE INDICATORS
As at, or years ended December 31
2014 2013 Chg
Subscriber count results (000s) 2
Wireless subscribers 9,450 9,503 (53)
Internet subscribers 2,011 1,961 50
Television subscribers 2,024 2,127 (103)
Phone subscribers 1,150 1,153 (3)
Additional wireless metrics 2
Wireless postpaid churn (monthly) 1.27% 1.24% 0.03 pts
Wireless postpaid ARPU (monthly) $ 66.86 $ 67.76 ($0.90)
Ratios
Capital intensity 218.4% 17.6% 0.8 pts
Dividend payout ratio 270% 54% 16 pts
Dividend payout ratio of free cash flow 1, 2 66% 58% 8 pts
Return on assets 25.1% 7.1% (2.0 pts)
Adjusted net debt / adjusted operating profit 12.9 2.4 0.5
Employee-related information
Number of employees (approximate) 27,000 28,000 (4%)
1Adjusted operating profit, adjusted operating profit margin, adjusted net income, adjusted diluted earnings per share, free cash flow and adjusted net debt / adjusted
operating profit are non-GAAP measures and should not be considered as a substitute or alternative for GAAP measures. They are not defined terms under IFRS, and do not
have standard meanings, so may not be a reliable way to compare us to other companies. See “Non-GAAP Measures” for information about these measures, including how we
calculate them.
2As defined. See “Key Performance Indicators”.
2014 ANNUAL REPORT ROGERS COMMUNICATIONS INC. 27