Rogers 2014 Annual Report Download - page 60
Download and view the complete annual report
Please find page 60 of the 2014 Rogers annual report below. You can navigate through the pages in the report by either clicking on the pages listed below, or by using the keyword search tool below to find specific information within the annual report.-
 1
1 -
2
-
3
-
4
-
5
-
6
-
7
-
8
-
9
-
10
-
11
-
12
-
13
-
14
-
15
-
16
-
17
-
18
-
19
-
20
-
21
-
22
-
23
-
24
-
25
-
26
-
27
-
28
-
29
-
30
-
31
-
32
-
33
-
34
-
35
-
36
-
37
-
38
-
39
-
40
-
41
-
42
-
43
-
44
-
45
-
46
-
47
-
48
-
49
-
 50
50 -
 51
51 -
 52
52 -
 53
53 -
 54
54 -
 55
55 -
 56
56 -
 57
57 -
 58
58 -
 59
59 -
 60
60 -
 61
61 -
 62
62 -
 63
63 -
 64
64 -
 65
65 -
 66
66 -
 67
67 -
 68
68 -
 69
69 -
 70
70 -
71
-
72
-
73
-
74
-
75
-
76
-
77
-
78
-
79
-
80
-
81
-
82
-
83
-
84
-
85
-
86
-
87
-
88
-
89
-
90
-
91
-
92
-
93
-
94
-
95
-
96
-
97
-
98
-
99
-
100
-
101
-
102
-
103
-
104
-
105
-
106
-
107
-
108
-
109
-
110
-
111
-
112
-
113
-
114
-
115
-
116
-
117
-
118
-
119
-
120
-
121
-
122
-
123
-
124
-
125
-
126
-
127
-
128
-
129
-
130
-
131
-
132
-
133
-
134
-
135
-
136
-
137
-
138
-
139
-
140
 |
 |

MANAGEMENT’S DISCUSSION AND ANALYSIS
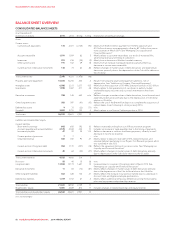
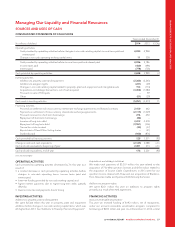
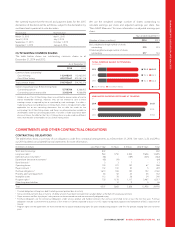
BALANCE SHEET OVERVIEW
CONSOLIDATED BALANCE SHEETS
As at December 31
(In millions of dollars) 2014 2013 $ Chg % Chg Explanation of significant changes
Assets
Current assets:
Cash and cash equivalents 176 2,301 (2,125) (92) Mainly from the $3.3 billion payment for 700 MHz spectrum and
$1.2 billion of senior note repayments offset by $2.1 billion from senior
note issuances in March 2014. See “Managing Our Liquidity and
Financial Resources”.
Accounts receivable 1,591 1,509 82 5 Mainly relates to customer receivables as a result of increased NHL
advertising revenue and timing of collections.
Inventories 251 276 (25) (9) Mainly from a decrease in Wireless handset inventory.
Other current assets 191 162 29 18 Mainly from an increase in prepaid expenses partially offset by a
decrease in income taxes receivable.
Current portion of derivative instruments 136 73 63 86 Reflects changes in market values of debt derivatives and expenditure
derivatives primarily due to the depreciation of the Cdn dollar relative to
the US dollar.
Total current assets 2,345 4,321 (1,976) (46)
Property, plant and equipment 10,655 10,255 400 4 Results from property, plant and equipment additions, net of
depreciation. See “Additions to Property, Plant and Equipment”.
Intangible assets 6,588 3,211 3,377 105 Mainly from the acquisition of 700 MHz spectrum licences of $3.3 billion.
Investments 1,898 1,487 411 28 Mainly relates to the appreciation of our shares in publicly traded
marketable equity securities and our initial investment in the shomi
venture.
Derivative instruments 788 148 640 n/m Reflects changes in market values of debt derivatives, bond forwards and
expenditure derivatives primarily due to the depreciation of Cdn dollar
relative to US dollar.
Other long-term assets 356 397 (41) (10) Reflects the use of the $46 million deposit to complete the acquisition of
certain dealer stores following its closing in early 2014.
Deferred tax assets 931 (22) (71) n/m
Goodwill 3,883 3,751 132 4 Mainly relates to our Source Cable acquisition in 2014.
Total assets 26,522 23,601 2,921 12
Liabilities and shareholders’ equity
Current liabilities:
Short-term borrowings 842 650 192 30 Reflects increased funding from our A/R securitization program.
Accounts payable and accrued liabilities 2,578 2,344 234 10 Includes an increase in trade payables due to the timing of payments.
Income tax payable 47 22 25 114 Reflects a decrease in cash tax installment payments, offset by a small
decrease in income tax expense.
Current portion of provisions 77 – – n/m.
Unearned revenue 443 350 93 27 Mainly relates to deposits received for NHL-related initiatives and
revenue deferrals pertaining to our Rogers First Rewards program which
was launched in late 2013.
Current portion of long-term debt 963 1,170 (207) (18) Reflects the repayment timing of our senior notes. See “Managing our
Liquidity and Financial Resources”.
Current portion of derivative instruments 40 63 (23) (37) Mainly reflects changes in market values of debt derivatives primarily
due to depreciation of the Cdn dollar relative to the US dollar.
Total current liabilities 4,920 4,606 314 7
Provisions 55 40 15 38 n/m
Long-term debt 13,824 12,173 1,651 14 Increased due to issuances of long-term debt in March 2014. See
“Managing our Liquidity and Financial Resources”.
Derivative instruments 11 83 (72) (87) Mainly reflects changes in market values of debt derivatives primarily
due to the depreciation of the Cdn dollar relative to the US dollar.
Other long-term liabilities 462 328 134 41 Mainly reflects the increase in our pension liability due to a decrease in
discount rates and higher employee participation.
Deferred tax liabilities 1,769 1,702 67 4 Mainly reflects additional temporary differences arising from property,
plant and equipment and partnership reserves.
Total liabilities 21,041 18,932 2,109 11
Shareholders’ equity 5,481 4,669 812 17 Includes changes in retained earnings and equity reserves.
Total liabilities and shareholders’ equity 26,522 23,601 2,921 12
n/m: not meaningful.
56 ROGERS COMMUNICATIONS INC. 2014 ANNUAL REPORT