Rogers 2014 Annual Report Download - page 129
Download and view the complete annual report
Please find page 129 of the 2014 Rogers annual report below. You can navigate through the pages in the report by either clicking on the pages listed below, or by using the keyword search tool below to find specific information within the annual report.-
 1
1 -
2
-
3
-
4
-
5
-
6
-
7
-
8
-
9
-
10
-
11
-
12
-
13
-
14
-
15
-
16
-
17
-
18
-
19
-
20
-
21
-
22
-
23
-
24
-
25
-
26
-
27
-
28
-
29
-
30
-
31
-
32
-
33
-
34
-
35
-
36
-
37
-
38
-
39
-
40
-
41
-
42
-
43
-
44
-
45
-
46
-
47
-
48
-
49
-
50
-
51
-
52
-
53
-
54
-
55
-
56
-
57
-
58
-
59
-
60
-
61
-
62
-
63
-
64
-
65
-
66
-
67
-
68
-
69
-
70
-
71
-
72
-
73
-
74
-
75
-
76
-
77
-
78
-
79
-
80
-
81
-
82
-
83
-
84
-
85
-
86
-
87
-
88
-
89
-
90
-
91
-
92
-
93
-
94
-
95
-
96
-
97
-
98
-
99
-
100
-
101
-
102
-
103
-
104
-
105
-
106
-
107
-
108
-
109
-
110
-
111
-
112
-
113
-
114
-
115
-
116
-
117
-
118
-
 119
119 -
 120
120 -
 121
121 -
 122
122 -
 123
123 -
 124
124 -
 125
125 -
 126
126 -
 127
127 -
 128
128 -
 129
129 -
 130
130 -
 131
131 -
 132
132 -
 133
133 -
 134
134 -
 135
135 -
 136
136 -
 137
137 -
 138
138 -
 139
139 -
140
 |
 |

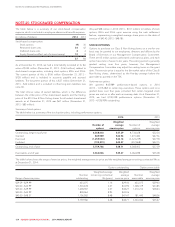
NOTES TO CONSOLIDATED FINANCIAL STATEMENTS
Unrecognized stock-based compensation expense as at December 31,
2014 related to stock-option plans was $7 million (2013 – $11 million),
and will be recorded in net income over the next four years as the
options vest.
RESTRICTED SHARE UNITS
The RSU plan allows employees, officers and directors to participate in
the growth and development of Rogers. Under the terms of the plan,
RSUs are issued to the participant and the units issued cliff vest over a
period of up to three years from the grant date.
On the vesting date, we will redeem all of the participants’ RSUs in cash
or by issuing one Class B Non-Voting share for each RSU. We have
reserved 4,000,000 Class B Non-Voting shares for issue under this
plan. We granted 1,088,951 RSUs in 2014 (2013 – 871,988).
Performance RSUs
We granted 313,291 performance-based RSUs in 2014
(2013 – 232,220) to certain key executives. The number of units that
vest and will be paid three years from the grant date will be within 50%
to 150% of the initial number granted based upon the achievement of
certain annual and cumulative three-year non-market targets.
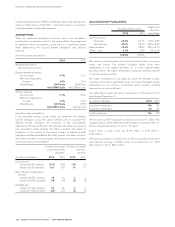
Summary of RSUs
The table below is a summary of the RSUs outstanding, including
performance RSUs.
(in number of units) 2014 2013
Outstanding, beginning of year 2,472,390 2,255,158
Granted and reinvested dividends 1,402,242 1,104,208
Exercised (828,645) (681,652)
Forfeited (280,732) (205,324)
Outstanding, end of year 2,765,255 2,472,390
Unrecognized stock-based compensation expense as at December 31,
2014 related to these RSUs was $48 million (2013 – $42 million) and
will be recorded in net income over the next three years as the RSUs
vest.
DEFERRED SHARE UNIT PLAN
The DSU plan allows directors, certain key executives and other senior
management to elect to receive certain types of compensation in
DSUs.
We granted 125,979 DSUs in 2014 (2013 – 103,990). As at
December 31, 2014, 826,891 DSUs (2013 – 700,912) were
outstanding. Unrecognized stock-based compensation expense as at
December 31, 2014, related to these DSUs was $2 million (2013 –
$2 million) and will be recorded in net income over the next three
years as the executive DSUs vest. All other DSUs are fully vested.
EMPLOYEE SHARE ACCUMULATION PLAN
Participation in the plan is voluntary. Employees can contribute up to
10% of their regular earnings through payroll deductions (up to an
annual maximum of $25,000). The plan administrator purchases our
Class B Non-Voting shares on a monthly basis on the open market on
behalf of the employee. At the end of each month, we make a
contribution of 25% to 50% of the employee’s contribution that month,
and the plan administrator uses this amount to purchase additional
shares on behalf of the employee. We record our contributions made
as a compensation expense.
Compensation expense related to the employee share accumulation
plan was $38 million in 2014 (2013 – $30 million).
EQUITY DERIVATIVES
We have entered into equity derivatives to hedge a portion of our
stock-based compensation expense (see note 16) and recognized a
$10 million loss (2013 – $8 million loss) in stock-based compensation
expense for these derivatives.
ASSUMPTIONS
Significant management estimates areusedtodeterminethefairvalue
of stock options, RSUs and DSUs. The table below shows the
weighted-average fair value of stock options granted during 2014 and
2013, and the principal assumptions used in applying the Black-
Scholes model for non-performance-based options and trinomial
option pricing models for performance-based options to determine
their fair value at grant date:
2014 2013
Weighted average fair value $ 7.35 $9.68
Risk-free interest rate 1.2% 1.2%
Dividend yield 4.0% 3.4%
Volatility of Class B Non-Voting shares 25.7% 26.2%
Weighted average expected life n/a n/a
Weighted average time to vest 2.4 years 2.4 years
Weighted average time to expiry 9.9 years 9.9 years
Employee exit rate 3.9% 3.3%
Suboptimal exercise factor 1.6 1.5
Lattice steps 50 50
Volatility has been estimated based on the actual trading statistics of
our Class B Non-Voting shares.
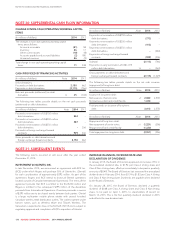
NOTE 26: BUSINESS COMBINATIONS
We made several acquisitions in 2014 and 2013, which we describe
below. Goodwill recognized in the 2014 dealer store acquisition is
deductible for tax purposes and all other goodwill recognized on
these acquisitions is not tax deductible. Goodwill represents the
expected operational synergies with the business acquired and/or
intangible assets that do not qualify to be recognized separately.
2014 ACQUISITIONS
Dealer stores
In January 2014, we completed an asset acquisition of certain dealer
stores located in British Columbia, Alberta and Ontario for cash
consideration of $46 million, which was paid as a deposit in the fourth
quarter of 2013. The dealer stores are a retail distribution outlet
business and sell telecommunication products and services. The
acquisition of the dealer stores provide increased product penetration.
2014 ANNUAL REPORT ROGERS COMMUNICATIONS INC. 125