Rogers 2014 Annual Report Download - page 90
Download and view the complete annual report
Please find page 90 of the 2014 Rogers annual report below. You can navigate through the pages in the report by either clicking on the pages listed below, or by using the keyword search tool below to find specific information within the annual report.-
 1
1 -
2
-
3
-
4
-
5
-
6
-
7
-
8
-
9
-
10
-
11
-
12
-
13
-
14
-
15
-
16
-
17
-
18
-
19
-
20
-
21
-
22
-
23
-
24
-
25
-
26
-
27
-
28
-
29
-
30
-
31
-
32
-
33
-
34
-
35
-
36
-
37
-
38
-
39
-
40
-
41
-
42
-
43
-
44
-
45
-
46
-
47
-
48
-
49
-
50
-
51
-
52
-
53
-
54
-
55
-
56
-
57
-
58
-
59
-
60
-
61
-
62
-
63
-
64
-
65
-
66
-
67
-
68
-
69
-
70
-
71
-
72
-
73
-
74
-
75
-
76
-
77
-
78
-
79
-
 80
80 -
 81
81 -
 82
82 -
 83
83 -
 84
84 -
 85
85 -
 86
86 -
 87
87 -
 88
88 -
 89
89 -
 90
90 -
 91
91 -
 92
92 -
 93
93 -
 94
94 -
 95
95 -
 96
96 -
 97
97 -
 98
98 -
 99
99 -
 100
100 -
101
-
102
-
103
-
104
-
105
-
106
-
107
-
108
-
109
-
110
-
111
-
112
-
113
-
114
-
115
-
116
-
117
-
118
-
119
-
120
-
121
-
122
-
123
-
124
-
125
-
126
-
127
-
128
-
129
-
130
-
131
-
132
-
133
-
134
-
135
-
136
-
137
-
138
-
139
-
140
 |
 |

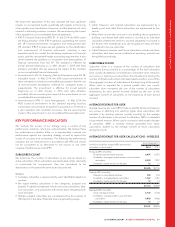
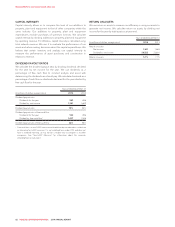
MANAGEMENT’S DISCUSSION AND ANALYSIS
FIVE-YEAR SUMMARY OF CONSOLIDATED FINANCIAL RESULTS
(In millions of dollars, except per share amounts, subscriber count results, ARPU, churn,
percentages and ratios)
Years ended December 31
2014 2013 2012 2011 2010
Income and Cash Flow:
Revenue
Wireless 7,305 7,270 7,280 7,138 6,973
Cable 3,467 3,475 3,358 3,309 3,190
Business Solutions 382 374 351 405 452
Media 1,826 1,704 1,620 1,611 1,461
Corporate items and intercompany eliminations (130) (117) (123) (117) (77)
12,850 12,706 12,486 12,346 11,999
Adjusted operating profit 1
Wireless 3,246 3,157 3,063 3,036 3,173
Cable 1,665 1,718 1,605 1,549 1,419
Business Solutions 122 106898640
Media 131 161 190 180 131
Corporate items and intercompany eliminations (145) (149) (113) (112) (95)
5,019 4,993 4,834 4,739 4,668
Net income from continuing operations 1,341 1,669 1,725 1,590 1,532
Net income 1,341 1,669 1,693 1,563 1,502
Adjusted net income from continuing operations 11,532 1,769 1,781 1,736 1,704
Free cash flow 11,437 1,548 1,649 1,874 1,983
Property, plant and equipment expenditures 2,366 2,240 2,142 2,127 1,821
Earnings per share from continuing operations:
Basic 2.60 3.24 3.32 2.93 2.66
Diluted 2.56 3.22 3.30 2.91 2.64
Earnings per share
Basic 2.60 3.24 3.26 2.88 2.61
Diluted 2.56 3.22 3.24 2.86 2.59
Adjusted earnings per share 1
Basic 2.97 3.43 3.43 3.20 2.96
Diluted 2.96 3.42 3.41 3.17 2.94
Balance Sheet:
Assets
Property, plant and equipment, net 10,655 10,255 9,576 9,114 8,437
Goodwill 3,883 3,751 3,215 3,280 3,108
Intangible assets 6,588 3,211 2,951 2,721 2,591
Investments 1,898 1,487 1,484 1,107 933
Other assets 3,498 4,897 2,392 2,140 1,964
26,522 23,601 19,618 18,362 17,033
Liabilities and Shareholders’ Equity
Long-term liabilities 16,121 14,326 12,848 12,241 10,440
Current liabilities 4,920 4,606 3,002 2,549 2,833
Total liabilities 21,041 18,932 15,850 14,790 13,273
Shareholders’ equity 5,481 4,669 3,768 3,572 3,760
26,522 23,601 19,618 18,362 17,033
Subscriber count results (000s) 2
Wireless subscribers 9,450 9,503 9,437 9,335 8,977
Internet subscribers 2,011 1,961 1,864 1,793 1,686
Television subscribers 2,024 2,127 2,214 2,297 2,305
Phone subscribers 1,150 1,153 1,074 1,052 1,003
Additional wireless metrics 2
Wireless postpaid ARPU (monthly) 66.86 67.76 69.30 70.26 72.62
Wireless postpaid churn (monthly) 1.27% 1.24% 1.29% 1.32% 1.18%
Ratios:
Revenue growth 31% 2% 1% 3% 4%
Adjusted operating profit growth 1,3 1% 3% 2% 2% 6%
Dividends declared per share 1.83 1.74 1.58 1.42 1.28
Dividend payout ratio 270% 54% 48% 49% 49%
Dividend payout ratio of free cash flow 166% 58% 50% 41% 37%
Return on assets 25.1% 7.1% 8.6% 8.5% 8.8%
Adjusted net debt/adjusted operating profit 1,2 2.9 2.4 2.3 2.2 2.1
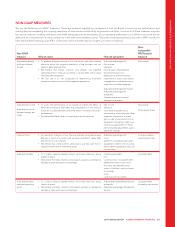
1Adjusted operating profit, adjusted net income, adjusted basic and diluted earnings per share, free cash flow and adjusted net debt are non-GAAP measures and should not
be considered as a substitute or alternative for GAAP measures. These are not defined terms under IFRS, and do not have standard meanings, so may not be a reliable way to
compare us to other companies. See “Non-GAAP Measures” for information about these measures, including how we calculate them.
2As defined. See “Key Performance Indicators”.
3Growth rates for 2010 are determined by comparing IFRS figures to figures prepared under Canadian GAAP in 2009.
86 ROGERS COMMUNICATIONS INC. 2014 ANNUAL REPORT