Rogers 2014 Annual Report Download - page 59
Download and view the complete annual report
Please find page 59 of the 2014 Rogers annual report below. You can navigate through the pages in the report by either clicking on the pages listed below, or by using the keyword search tool below to find specific information within the annual report.-
 1
1 -
2
-
3
-
4
-
5
-
6
-
7
-
8
-
9
-
10
-
11
-
12
-
13
-
14
-
15
-
16
-
17
-
18
-
19
-
20
-
21
-
22
-
23
-
24
-
25
-
26
-
27
-
28
-
29
-
30
-
31
-
32
-
33
-
34
-
35
-
36
-
37
-
38
-
39
-
40
-
41
-
42
-
43
-
44
-
45
-
46
-
47
-
48
-
 49
49 -
 50
50 -
 51
51 -
 52
52 -
 53
53 -
 54
54 -
 55
55 -
 56
56 -
 57
57 -
 58
58 -
 59
59 -
 60
60 -
 61
61 -
 62
62 -
 63
63 -
 64
64 -
 65
65 -
 66
66 -
 67
67 -
 68
68 -
 69
69 -
70
-
71
-
72
-
73
-
74
-
75
-
76
-
77
-
78
-
79
-
80
-
81
-
82
-
83
-
84
-
85
-
86
-
87
-
88
-
89
-
90
-
91
-
92
-
93
-
94
-
95
-
96
-
97
-
98
-
99
-
100
-
101
-
102
-
103
-
104
-
105
-
106
-
107
-
108
-
109
-
110
-
111
-
112
-
113
-
114
-
115
-
116
-
117
-
118
-
119
-
120
-
121
-
122
-
123
-
124
-
125
-
126
-
127
-
128
-
129
-
130
-
131
-
132
-
133
-
134
-
135
-
136
-
137
-
138
-
139
-
140
 |
 |

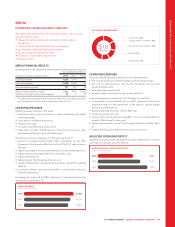
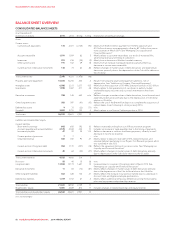
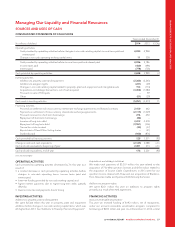
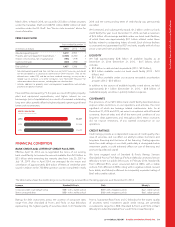
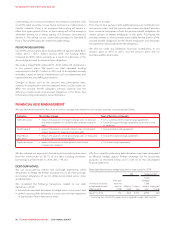
MANAGEMENT’S DISCUSSION AND ANALYSIS
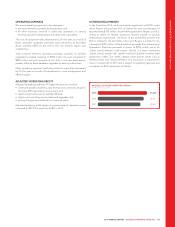
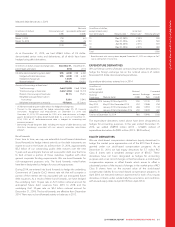
FOURTH QUARTER 2014 RESULTS
OPERATING REVENUE
Wireless network revenue increasedinthefourthquarterprimarily
because of the continued adoption of higher ARPU-generating Rogers
Share Everything Plans and greater smartphone sales.
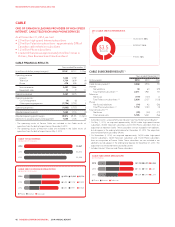
Cable operating revenue was stable in the fourth quarter because the
impact of a higher subscriber base for our Internet products,
combined with the movement of customers to higher-end speed and
usage tiers. This was offset by Television subscriber losses over the
past year and lower Phone revenue from promotional discounting.
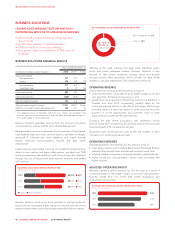
Business Solutions operating revenue decreased in the fourth quarter
because of the continued decline in the legacy off-net voice and data
business, partially offset by continued growth of on-net and next
generation IP-based services revenue and higher revenue from data
centre operations.
Media operating revenue increased in the fourth quarter primarily
because of the NHL Agreement, higher subscription revenue
generated by our Sportsnet properties, higher radio revenue, and
revenue growth in Next Issue Canada, partially offset by continued
softness in conventional television and print advertising.
ADJUSTED OPERATING PROFIT
Wireless adjusted operating profit increased in the fourth quarter
primarily because of the increased network revenue described above,
partially offset by higher costs for smartphones sold.
Cable adjusted operating profit decreased in the fourth quarter
primarily because of investments in programming and customer value
enhancement related costs.
Media’s adjusted operating profit increased in the fourth quarter
because of the revenue changes described above and cost efficiencies
in Television and Publishing.
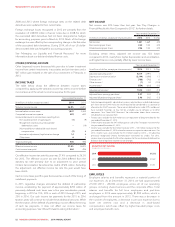
NET INCOME AND ADJUSTED NET INCOME
Net income decreased in the fourth quarter primarily from the changes
reflected in the increase in adjusted operating profit discussed above,
and higher depreciation and amortization, higher restructuring,
acquisition and other, and higher income taxes.
Adjusted net income was $355 million in the fourth quarter of 2014,
with adjusted diluted earnings per share of $0.69. This was in-line with
adjusted net income of $357 million and adjusted diluted earnings per
share of $0.69 in the fourth quarter of 2013.
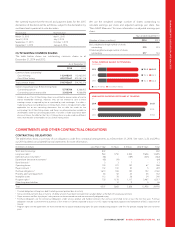
QUARTERLY TRENDS AND SEASONALITY
Our operating results generally vary from quarter to quarter because of
changes in general economic conditions and seasonal fluctuations,
among other things, in each of our business segments. This means our
results in one quarter are not a good indication of how we will perform
in a future quarter. Wireless, Cable and Media each have unique
seasonal aspects to, and certain other historical trends in, their
businesses.
Fluctuations in net income from quarter to quarter can also be
attributed to losses on the repayment of debt, foreign exchange gains
or losses, changes in the fair value of derivative instruments, other
income and expenses, impairment of assets and changes in income
taxes.
Wireless
The trends in Wireless revenue and adjusted operating profit reflect:
• the growing number of wireless voice and data subscribers;
• higher usage of wireless data;
• higher handset subsidies as more consumers shift to smartphones;
and
• a slight increase in churn reflecting our heightened focus towards
higher valued customers away from customers that generate lower
margins.
We continue to target higher value postpaid subscribers, which has
contributedtothesignificantlyheavier mix of postpaid versus prepaid
subscribers. Growth in our customer base over time has resulted in
higher costs for customer service, retention, credit and collection;
however, most of the cost increases have been offset by gains in
operating efficiencies.
Wireless operating results are influenced by the timing of our
marketing and promotional expenditures and higher levels of
subscriber additions and related subsidies, resulting in higher
subscriber acquisition and activation-related expenses in certain
periods. This increased activity generally occurs in the third and fourth
quarters, and can also occur or be accentuated by the launch of
popular new wireless handset models.
Cable
The trends in Cable services revenue and operating profit are primarily
due to:
• higher penetration and usage of Internet, digital and telephony
products and services; and
• pricing increases over the past year; offset by
• competitive losses of Television subscribers.
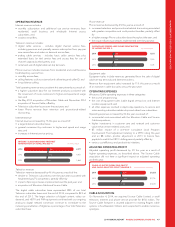
Cable’s operating results are affected by modest seasonal fluctuations
in subscriber additions and disconnections, typically caused by:
• university and college students moving;
• individuals temporarily suspending service for extended vacations
or seasonal relocations; and
• the concentrated marketing we generally conduct in our fourth
quarter.
Business Solutions
The trends in Business Solutions operating profit margin primarily
reflect the ongoing shift from lower-margin, off-net legacy long
distance and data services to higher-margin, next generation services
and data centre businesses.
Business Solutions does not generally have any unique seasonal
aspects to its business.
Media
The trends in Media’s results are generally the result of continual
investment in prime-time and specialty programming, higher sports
rights costs, subscriber rate increases, and fluctuations in advertising
and consumer market conditions.
Seasonal fluctuations relate to periods of increased consumer activity
and their impact on advertising and related retail cycles, the MLB
season, where revenues and expenses are concentrated in the spring,
summer and fall months, and the NHL season, where advertising
revenues and programming expenses are concentrated in the fall and
winter months.
2014 ANNUAL REPORT ROGERS COMMUNICATIONS INC. 55