Rogers 2014 Annual Report Download - page 61
Download and view the complete annual report
Please find page 61 of the 2014 Rogers annual report below. You can navigate through the pages in the report by either clicking on the pages listed below, or by using the keyword search tool below to find specific information within the annual report.-
 1
1 -
2
-
3
-
4
-
5
-
6
-
7
-
8
-
9
-
10
-
11
-
12
-
13
-
14
-
15
-
16
-
17
-
18
-
19
-
20
-
21
-
22
-
23
-
24
-
25
-
26
-
27
-
28
-
29
-
30
-
31
-
32
-
33
-
34
-
35
-
36
-
37
-
38
-
39
-
40
-
41
-
42
-
43
-
44
-
45
-
46
-
47
-
48
-
49
-
50
-
 51
51 -
 52
52 -
 53
53 -
 54
54 -
 55
55 -
 56
56 -
 57
57 -
 58
58 -
 59
59 -
 60
60 -
 61
61 -
 62
62 -
 63
63 -
 64
64 -
 65
65 -
 66
66 -
 67
67 -
 68
68 -
 69
69 -
 70
70 -
 71
71 -
72
-
73
-
74
-
75
-
76
-
77
-
78
-
79
-
80
-
81
-
82
-
83
-
84
-
85
-
86
-
87
-
88
-
89
-
90
-
91
-
92
-
93
-
94
-
95
-
96
-
97
-
98
-
99
-
100
-
101
-
102
-
103
-
104
-
105
-
106
-
107
-
108
-
109
-
110
-
111
-
112
-
113
-
114
-
115
-
116
-
117
-
118
-
119
-
120
-
121
-
122
-
123
-
124
-
125
-
126
-
127
-
128
-
129
-
130
-
131
-
132
-
133
-
134
-
135
-
136
-
137
-
138
-
139
-
140
 |
 |

MANAGEMENT’S DISCUSSION AND ANALYSIS
Managing Our Liquidity and Financial Resources
SOURCES AND USES OF CASH
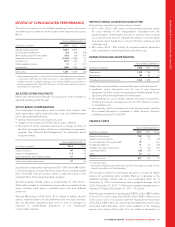
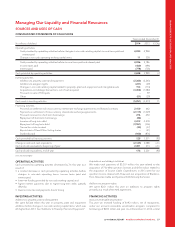
CONSOLIDATED STATEMENTS OF CASH FLOWS
Years ended December 31
(In millions of dollars) 2014 2013 % Chg
Operating activities:
Cash provided by operating activities before changes in non-cash working capital, income taxes paid and
interest paid
4,925 4,948
Change in non-cash operating working capital items 11 238
Cash provided by operating activities before income taxes paid and interest paid 4,936 5,186
Income taxes paid (460) (496)
Interest paid (778) (700)
Cash provided by operating activities 3,698 3,990 (7)
Investing activities:
Additions to property, plant and equipment (2,366) (2,240)
Additions to program rights (231) (69)
Changes in non-cash working capital related to property, plant and equipment and intangible assets 153 (114)
Acquisitions and strategic transactions, net of cash acquired (3,456) (1,080)
Proceeds on sale of TVtropolis –59
Other (51) (29)
Cash used in investing activities (5,951) (3,473) 71
Financing activities:
Proceeds on settlement of cross-currency interest rate exchange agreements and forward contracts 2,150 662
Payments on settlement of cross-currency interest rate exchange agreements (2,115) (1,029)
Proceeds received on short-term borrowings 276 650
Repayment of short-term borrowings (84) –
Issuance of long-term debt 3,412 2,578
Repayment of long-term debt (2,551) (356)
Transaction costs incurred (30) (37)
Repurchase of Class B Non-Voting shares –(21)
Dividends paid (930) (876)
Cash provided by financing activities 128 1,571 (92)
Change in cash and cash equivalents (2,125) 2,088 n/m
Cash and cash equivalents, beginning of year 2,301 213 n/m
Cash and cash equivalents, end of year 176 2,301 (92)
n/m: not meaningful.
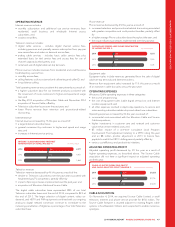
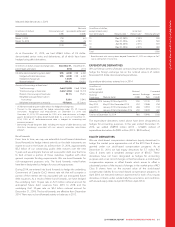
OPERATING ACTIVITIES
Cash provided by operating activities decreased by 7% this year as a
result of:
• a modest decrease in cash provided by operating activities before
changes in non-cash operating items, income taxes paid and
interest paid;
• lower net funding provided by non-cash working capital; and
• higher interest payments due to higher long-term debt; partially
offset by
• lower income tax cash payments due to timing.
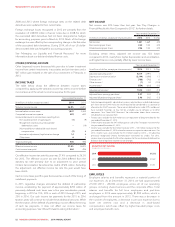
INVESTING ACTIVITIES
Additions to property, plant and equipment
We spent $2,366 million this year on property, plant and equipment
additions before changes in non-cash working capital items, which was
6% higher than 2013. See “Additions to Property, Plant and Equipment”.
Acquisitions and strategic initiatives
We made total payments of $3,301 million this year related to the
acquisition of 700 MHz spectrum licences and $156 million related to
the acquisition of Source Cable. Expenditures in 2013 were for our
spectrum licence deposit with Shaw and our acquisitions of Blackiron,
Pivot, Mountain Cable and Sportsnet 360 (formerly theScore).
Additions to program rights
We spent $231 million this year on additions to program rights
primarily as a result of the NHL Agreement.
FINANCING ACTIVITIES
Accounts receivable securitization
This year we received funding of $192 million, net of repayments,
under our accounts receivable securitization program, compared to
borrowings of $650 million last year. As at December 31, 2014, a total
2014 ANNUAL REPORT ROGERS COMMUNICATIONS INC. 57