Rogers 2014 Annual Report Download - page 46
Download and view the complete annual report
Please find page 46 of the 2014 Rogers annual report below. You can navigate through the pages in the report by either clicking on the pages listed below, or by using the keyword search tool below to find specific information within the annual report.-
 1
1 -
2
-
3
-
4
-
5
-
6
-
7
-
8
-
9
-
10
-
11
-
12
-
13
-
14
-
15
-
16
-
17
-
18
-
19
-
20
-
21
-
22
-
23
-
24
-
25
-
26
-
27
-
28
-
29
-
30
-
31
-
32
-
33
-
34
-
35
-
 36
36 -
 37
37 -
 38
38 -
 39
39 -
 40
40 -
 41
41 -
 42
42 -
 43
43 -
 44
44 -
 45
45 -
 46
46 -
 47
47 -
 48
48 -
 49
49 -
 50
50 -
 51
51 -
 52
52 -
 53
53 -
 54
54 -
 55
55 -
 56
56 -
57
-
58
-
59
-
60
-
61
-
62
-
63
-
64
-
65
-
66
-
67
-
68
-
69
-
70
-
71
-
72
-
73
-
74
-
75
-
76
-
77
-
78
-
79
-
80
-
81
-
82
-
83
-
84
-
85
-
86
-
87
-
88
-
89
-
90
-
91
-
92
-
93
-
94
-
95
-
96
-
97
-
98
-
99
-
100
-
101
-
102
-
103
-
104
-
105
-
106
-
107
-
108
-
109
-
110
-
111
-
112
-
113
-
114
-
115
-
116
-
117
-
118
-
119
-
120
-
121
-
122
-
123
-
124
-
125
-
126
-
127
-
128
-
129
-
130
-
131
-
132
-
133
-
134
-
135
-
136
-
137
-
138
-
139
-
140
 |
 |

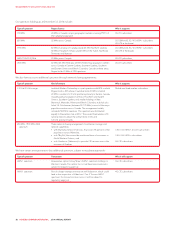
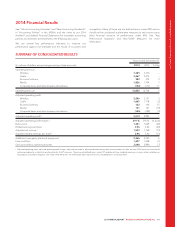
MANAGEMENT’S DISCUSSION AND ANALYSIS
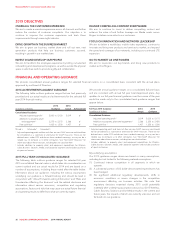
KEY CHANGES IN FINANCIAL RESULTS THIS
YEAR COMPARED TO 2013
(In millions of dollars) Change See page
Operating revenue changes – higher (lower):
Network – Wireless (5) 44
Equipment – Wireless 40 44
Cable (8) 47
Business Solutions 8 48
Media 122 49
Corporate items and intercompany eliminations (13)
Higher operating revenue compared to 2013 144
Adjusted operating profit changes – higher (lower):
Wireless 89 45
Cable (53) 47
Business Solutions 16 48
Media (30) 49
Corporate items and intercompany eliminations 4
Higher adjusted operating profit 1compared to 2013 26
Lower stock-based compensation 47 51
Higher restructuring, acquisition and other (88) 51
Higher depreciation and amortization (246) 51
Higher finance costs (75) 51
Higher other expense (82) 52
Lowerincometaxes 90 52
Lower net income compared to 2013 (328)
Lower stock-based compensation (47) 51
Higher restructuring, acquisition and other 88 51
Loss on repayment of long-term debt 29 51
Gain on sale of interest in TVtropolis 47 52
Income tax impact of the above items (32)
Income tax adjustment, legislative tax change 6 52
Lower adjusted net income 1compared to 2013 (237)
1Adjusted operating profit and adjusted net income are non-GAAP measures and
should not be considered as a substitute or alternative for GAAP measure. These are
not defined terms under IFRS, and do not have standard meanings, so may not be a
reliable way to compare us to other companies. See “Non-GAAP Measures” for
information about these measures, including how we calculate them.
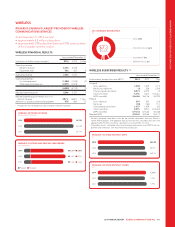
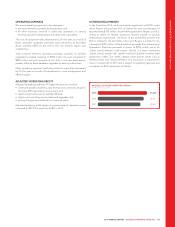
OPERATING REVENUE
Wireless network revenue remained fairly consistent this year primarily
because of the continued adoption of higher ARPU-generating Rogers
Share Everything Plans, offset by the introduction over the past year of
lower priced roaming plans.
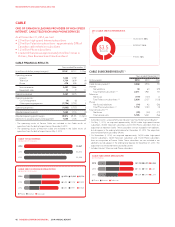
Cable operating revenue remained fairly consistent this year primarily
because the impact of a higher subscriber base for our Internet
products combined with the movement of customers to higher-end
speed and usage tiers was offset by TV subscriber losses over the past
year and a more competitive Phone pricing environment.
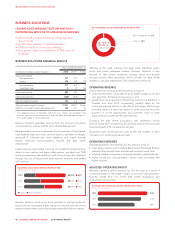
Business Solutions operating revenue increased this year primarily
because of continued growth in on-net and next generation services,
including our data centre businesses, partially offset by a reduction in
lower margin, off-net legacy revenue.
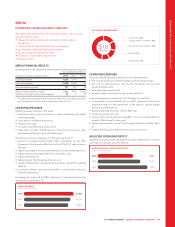
Media operating revenue increased this year primarily because of
revenue generated by our new NHL Agreement, growth at Sportsnet,
and higher revenues at the Toronto Blue Jays, The Shopping Channel,
and Radio, partially offset by continued softness in conventional TV and
print advertising.
ADJUSTED OPERATING PROFIT
Wireless adjusted operating profit increased this year primarily
because of lower subsidy levels.
Cable adjusted operating profit decreased this year primarily because
of higher investments in customer care and network, customer value
enhancement-related costs and a one-time cumulative CRTC fee
adjustment.
Business Solutions adjusted operating profit increased this year as a
result of continued growth in the higher margin on-net and next
generation business mostly from our recent data centre acquisitions
and productivity improvements.
Media’s adjusted operating profit decreased this year primarily
because of investments in player salaries at the Toronto Blue Jays,
increased merchandise costs at The Shopping Channel, ramp-up costs
associated with the launch of Next Issue Canada and increased
programming costs, partially offset by lower publishing costs.
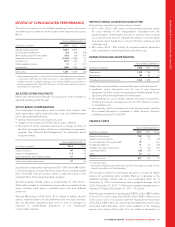
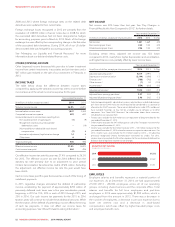
NET INCOME AND ADJUSTED NET INCOME
Net income and adjusted net income decreased this year primarily
because of the revenue and expense changes described above and
higher depreciation and amortization, and higher finance costs. Net
income was also lower as a result of higher restructuring, acquisition
and other costs.
42 ROGERS COMMUNICATIONS INC. 2014 ANNUAL REPORT