Rogers 2014 Annual Report Download - page 4
Download and view the complete annual report
Please find page 4 of the 2014 Rogers annual report below. You can navigate through the pages in the report by either clicking on the pages listed below, or by using the keyword search tool below to find specific information within the annual report.-
 1
1 -
 2
2 -
 3
3 -
 4
4 -
 5
5 -
 6
6 -
 7
7 -
 8
8 -
 9
9 -
 10
10 -
 11
11 -
 12
12 -
 13
13 -
 14
14 -
 15
15 -
16
-
17
-
18
-
19
-
20
-
21
-
22
-
23
-
24
-
25
-
26
-
27
-
28
-
29
-
30
-
31
-
32
-
33
-
34
-
35
-
36
-
37
-
38
-
39
-
40
-
41
-
42
-
43
-
44
-
45
-
46
-
47
-
48
-
49
-
50
-
51
-
52
-
53
-
54
-
55
-
56
-
57
-
58
-
59
-
60
-
61
-
62
-
63
-
64
-
65
-
66
-
67
-
68
-
69
-
70
-
71
-
72
-
73
-
74
-
75
-
76
-
77
-
78
-
79
-
80
-
81
-
82
-
83
-
84
-
85
-
86
-
87
-
88
-
89
-
90
-
91
-
92
-
93
-
94
-
95
-
96
-
97
-
98
-
99
-
100
-
101
-
102
-
103
-
104
-
105
-
106
-
107
-
108
-
109
-
110
-
111
-
112
-
113
-
114
-
115
-
116
-
117
-
118
-
119
-
120
-
121
-
122
-
123
-
124
-
125
-
126
-
127
-
128
-
129
-
130
-
131
-
132
-
133
-
134
-
135
-
136
-
137
-
138
-
139
-
140
 |
 |

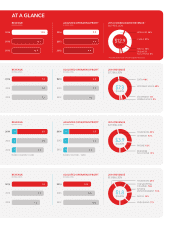
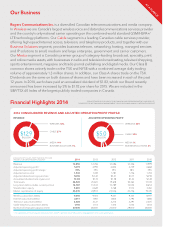
2014 CONSOLIDATED REVENUE AND ADJUSTED OPERATING PROFIT PROFILE
REVENUE
WIRELESS 56%
CABLE 27%
MEDIA 14%
BUSINESS SOLUTIONS 3%
$12.9
BILLION
Our Business
Rogers Communications Inc. is a diversified Canadian telecommunications and media company.
In Wireless we are Canada’s largest wireless voice and data telecommunications services provider
and the country’s only national carrier operating on the combined world standard GSM/HSPA+/
LTE technology platforms. Our Cable segment is a leading Canadian cable services provider,
offering high-speed Internet access, television, and telephony products, and together with our
Business Solutions segment, provides business telecom, networking, hosting, managed services
and IP solutions to small, medium and large enterprise, government and carrier customers.
Our Media segment is Canada’s premier group of category-leading broadcast, specialty, print
and online media assets, with businesses in radio and television broadcasting, televised shopping,
sports entertainment, magazine and trade journal publishing and digital media. Our Class B
common shares actively trade on the TSX and NYSE with a combined average daily trading
volume of approximately 1.3 million shares. In addition, our Class A shares trade on the TSX.
Dividends are the same on both classes of shares and have been increased in each of the past
12 years. In 2014, each share paid an annualized dividend of $1.83, which our Board recently
announced has been increased by 5% to $1.92 per share for 2015. We are included in the
S&P/TSX 60 Index of the largest publicly traded companies in Canada.
Financial Highlights 2014 FOR A DETAILED DISCUSSION OF OUR FINANCIAL AND OPERATING METRICS AND RESULTS,
PLEASE SEE THE ACCOMPANYING MANAGEMENT’S DISCUSSION AND ANALYSIS LATER IN THIS REPORT.
2014 2013 2012 2011 2010
Revenue 12,850 12,706 12,486 12,346 11,999
Adjusted operating profit 1 5,019 4,993 4,834 4,739 4,668
Adjusted operating profit margin 1 39% 39% 39% 38% 39%
Adjusted net income 1 1,532 1,769 1,781 1,736 1,704
Adjusted diluted earnings per share 1 $2.96 $3.42 $3.41 $3.17 $2.94
Annualized dividend rate at year-end $1.83 $1.74 $1.58 $1.42 $1.28
Total assets 26,522 23,601 19,618 18,362 17,033
Long-term debt (includes current portion) 14,787 13,343 10,789 10,034 8,654
Shareholders’ equity 5,481 4,669 3,768 3,572 3,760
Market capitalization of equity 23,435 24,903 23,346 20,736 19,435
Wireless subscribers (000s) 9,450 9,503 9,437 9,335 8,977
Internet subscribers (000s) 2,011 1,961 1,864 1,793 1,686
Television subscribers (000s) 2,024 2,127 2,214 2,297 2,305
Cable telephony subscribers (000s) 1,150 1,153 1,074 1,052 1,003
Number of employees (approximate) 27,000 28,000 27,000 29,000 28,000
1 For a definition of these measures (which are “Non-GAAP”) see “Non-GAAP Measures” in Management’s Discussion and Analysis.
ADJUSTED OPERATING PROFIT
WIRELESS 63%
MEDIA 3%
BUSINESS SOLUTIONS 2%
CABLE 32%
$5.0
BILLION
AT A GLANCE
(IN MILLIONS OF DOLLARS, EXCEPT MARGINS, PER SHARE
AMOUNTS, SUBSCRIBER AND EMPLOYEE DATA)