Rogers 2014 Annual Report Download - page 47
Download and view the complete annual report
Please find page 47 of the 2014 Rogers annual report below. You can navigate through the pages in the report by either clicking on the pages listed below, or by using the keyword search tool below to find specific information within the annual report.-
 1
1 -
2
-
3
-
4
-
5
-
6
-
7
-
8
-
9
-
10
-
11
-
12
-
13
-
14
-
15
-
16
-
17
-
18
-
19
-
20
-
21
-
22
-
23
-
24
-
25
-
26
-
27
-
28
-
29
-
30
-
31
-
32
-
33
-
34
-
35
-
36
-
 37
37 -
 38
38 -
 39
39 -
 40
40 -
 41
41 -
 42
42 -
 43
43 -
 44
44 -
 45
45 -
 46
46 -
 47
47 -
 48
48 -
 49
49 -
 50
50 -
 51
51 -
 52
52 -
 53
53 -
 54
54 -
 55
55 -
 56
56 -
 57
57 -
58
-
59
-
60
-
61
-
62
-
63
-
64
-
65
-
66
-
67
-
68
-
69
-
70
-
71
-
72
-
73
-
74
-
75
-
76
-
77
-
78
-
79
-
80
-
81
-
82
-
83
-
84
-
85
-
86
-
87
-
88
-
89
-
90
-
91
-
92
-
93
-
94
-
95
-
96
-
97
-
98
-
99
-
100
-
101
-
102
-
103
-
104
-
105
-
106
-
107
-
108
-
109
-
110
-
111
-
112
-
113
-
114
-
115
-
116
-
117
-
118
-
119
-
120
-
121
-
122
-
123
-
124
-
125
-
126
-
127
-
128
-
129
-
130
-
131
-
132
-
133
-
134
-
135
-
136
-
137
-
138
-
139
-
140
 |
 |

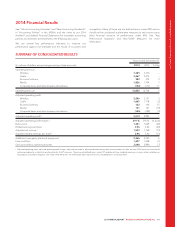
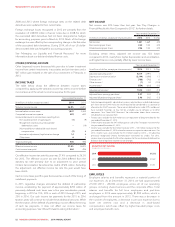
MANAGEMENT’S DISCUSSION AND ANALYSIS
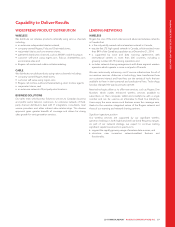
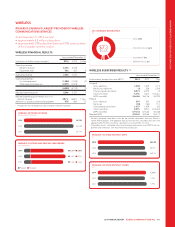
WIRELESS
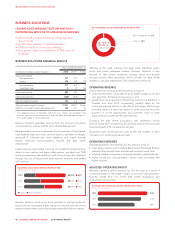
ROGERS IS CANADA’S LARGEST PROVIDER OF WIRELESS
COMMUNICATIONS SERVICES
As at December 31, 2014, we had:
• approximately 9.5 million subscribers
• approximately 35% subscriber share and 35% revenue share
of the Canadian wireless market.
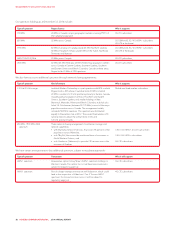
WIRELESS FINANCIAL RESULTS
Years ended December 31
(In millions of dollars, except margins) 2014 2013 % Chg
Operating revenue
Network revenue 6,743 6,748 –
Equipment sales 562 522 8
Operating revenue 7,305 7,270 –
Operating expenses
Cost of equipment 1(1,488) (1,535) (3)
Other operating expenses (2,571) (2,578) –
(4,059) (4,113) (1)
Adjusted operating profit 3,246 3,157 3
Adjusted operating profit margin as a % of
network revenue 48.1% 46.8% 1.3 pts
Additions to property, plant and equipment 978 865 13
1Includes the cost of equipment sales and direct channel subsidies.
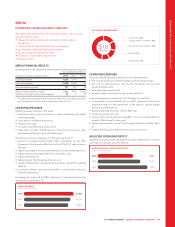
(IN MILLIONS OF DOLLARS)
WIRELESS NETWORK REVENUE
2014
2013
2012
$6,743
$6,748
$6,719
(IN THOUSANDS)
WIRELESS POSTPAID AND PREPAID SUBSCRIBERS
2014
2013
2012
1,377 8,073
1,429 8,074
1,591 7,846
PostpaidPrepaid
(%)
2014 WIRELESS REVENUE MIX
DATA 48%
POSTPAID VOICE 42%
EQUIPMENT 8%
PREPAID VOICE 2%
$7.3
BILLION
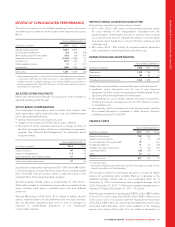
WIRELESS SUBSCRIBER RESULTS 1, 2
Years ended December 31
(In thousands, except churn and ARPU) 2014 2013 Chg
Postpaid
Gross additions 1,238 1,409 (171)
Net (losses) additions (1) 228 (229)
Total postpaid subscribers 8,073 8,074 (1)
Churn (monthly) 1.27% 1.24% 0.03 pts
ARPU (monthly) $ 66.86 $ 67.76 $ (0.90)
Prepaid
Gross additions 507 525 (18)
Net losses (52) (162) 110
Total prepaid subscribers 1,377 1,429 (52)
Churn (monthly) 3.42% 3.85% (0.43 pts)
ARPU (monthly) $ 15.16 $ 15.64 $ (0.48)
Blended ARPU $ 59.41 $ 59.58 $ (0.17)
1Wireless postpaid subscriber results do not include subscribers from our Wireless
Home Phone product, with approximately 52,000 net new subscribers this year and
approximately 92,000 cumulative subscribers as at December 31, 2014.
2Subscriber counts, subscriber churn and average revenue per user (ARPU) are key
performance indicators. See “Key Performance Indicators”.
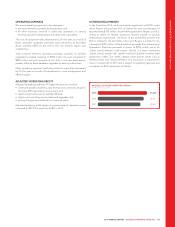
($)
WIRELESS POSTPAID MONTHLY ARPU
2014
2013
2012
$66.86
$67.76
$69.30
(%)
WIRELESS POSTPAID MONTHLY CHURN
2014
2013
2012
1.27%
1.24%
1.29%
2014 ANNUAL REPORT ROGERS COMMUNICATIONS INC. 43