Rogers 2014 Annual Report Download - page 52
Download and view the complete annual report
Please find page 52 of the 2014 Rogers annual report below. You can navigate through the pages in the report by either clicking on the pages listed below, or by using the keyword search tool below to find specific information within the annual report.-
 1
1 -
2
-
3
-
4
-
5
-
6
-
7
-
8
-
9
-
10
-
11
-
12
-
13
-
14
-
15
-
16
-
17
-
18
-
19
-
20
-
21
-
22
-
23
-
24
-
25
-
26
-
27
-
28
-
29
-
30
-
31
-
32
-
33
-
34
-
35
-
36
-
37
-
38
-
39
-
40
-
41
-
 42
42 -
 43
43 -
 44
44 -
 45
45 -
 46
46 -
 47
47 -
 48
48 -
 49
49 -
 50
50 -
 51
51 -
 52
52 -
 53
53 -
 54
54 -
 55
55 -
 56
56 -
 57
57 -
 58
58 -
 59
59 -
 60
60 -
 61
61 -
 62
62 -
63
-
64
-
65
-
66
-
67
-
68
-
69
-
70
-
71
-
72
-
73
-
74
-
75
-
76
-
77
-
78
-
79
-
80
-
81
-
82
-
83
-
84
-
85
-
86
-
87
-
88
-
89
-
90
-
91
-
92
-
93
-
94
-
95
-
96
-
97
-
98
-
99
-
100
-
101
-
102
-
103
-
104
-
105
-
106
-
107
-
108
-
109
-
110
-
111
-
112
-
113
-
114
-
115
-
116
-
117
-
118
-
119
-
120
-
121
-
122
-
123
-
124
-
125
-
126
-
127
-
128
-
129
-
130
-
131
-
132
-
133
-
134
-
135
-
136
-
137
-
138
-
139
-
140
 |
 |

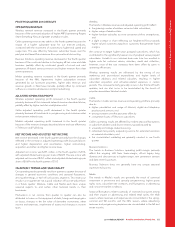
MANAGEMENT’S DISCUSSION AND ANALYSIS
BUSINESS SOLUTIONS
LEADING-EDGE WIRELINE TELECOM AND DATA
NETWORKING SERVICES TO CANADIAN BUSINESSES
• sells to small, medium and large enterprises and
governments
• sells to other carriers on a wholesale basis
• 7,800 on-net fibre connected buildings
• fibre passes close to an additional 23,000 near-net
buildings.
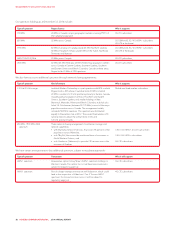
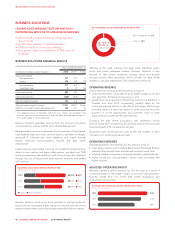
BUSINESS SOLUTIONS FINANCIAL RESULTS
Years ended December 31
(In millions of dollars, except margins) 2014 2013 1%Chg
Operating revenue
Next generation 271 213 27
Legacy 106 149 (29)
Service revenue 377 362 4
Equipment sales 512 (58)
Operating revenue 382 374 2
Operating expenses (260) (268) (3)
Adjusted operating profit 122 106 15
Adjusted operating profit margin 31.9% 28.3% 3.6 pts
Additions to property, plant, and equipment 146 107 36
1The operating results of Blackiron and Pivot Data Centres are included in the
Business Solutions results of operations from the dates of acquisition on April 17,
2013 and October 1, 2013, respectively.
Business Solutions generates revenue from the provision of wireline
communications services and the sales of related equipment.
Next generation revenue is generated by the provision of high-speed,
high-reliability data and voice communications, provided on Rogers’
advanced IP, Ethernet and cloud platforms, and mainly through
Rogers’ extensive communications network and data centre
infrastructure.
Legacy revenue is generated mainly by circuit-switched local and long-
distance voice services and legacy data services, provided over TDM
and prior generation data platforms, with client access often delivered
through the use of leased third-party network elements and tariffed
ILEC services.
(IN MILLIONS OF DOLLARS)
BUSINESS SOLUTIONS SERVICE REVENUE MIX
2014
2013
2012
$106 $271
$149 $213
$183 $162
Next GenerationLegacy
Business Solutions continues to focus primarily on next generation IP-
based services, leveraging higher margin on-net and near-net service
revenue opportunities, and using existing network facilities to expand
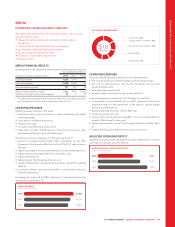
$377
MILLION
(%)
2014 BUSINESS SOLUTIONS SERVICE REVENUE MIX
NEXT GENERATION 72%
LEGACY 28%
offeringstothesmall,mediumandlargesizedenterprise,public
sector and carrier wholesale markets. Business Solutions is also
focused on data centre colocation, hosting, cloud, and disaster
recovery services. Next generation, which includes our data centre
operations, this year represented 72% of total service revenue.
OPERATING REVENUE
Service revenue increased by 4% this year as a result of:
• continuing execution of our plan to grow higher margin on-net and
next generation IP-based services revenue; and
• growth from the acquisitions of Pivot Data Centres and Blackiron in
October and April 2013, respectively; partially offset by the
continued planned decline in the off-net and legacy off-net voice
and data services, a trend we expect to continue as we focus the
business on on-net opportunities and customers move to more
advanced and cost effective IP-based services.
Excluding the data centre acquisitions, next generation service
revenue would have increased by 6% and total service revenue would
have decreased by 9% compared to last year.
Equipment sales decreased this year as the first quarter of 2013
included a non-recurring equipment sale.
OPERATING EXPENSES
Operating expenses decreased by 3% this year as a result of:
• lower legacy service costs including fewer leased third-party facilities
related to the planned lower volumes and customer levels; and
• ongoing initiatives to improve costs and productivity; partially offset by
• higher on-net and next generation service costs associated with
higher volumes.
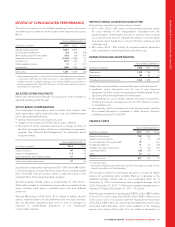
ADJUSTED OPERATING PROFIT
Adjusted operating profit increased by 15% this year as a result of
continued growth in the higher margin on-net and next generation
business mostly from our recent data centre acquisitions and
productivity improvements.
(IN MILLIONS OF DOLLARS)
BUSINESS SOLUTIONS ADJUSTED OPERATING PROFIT
2014
2013
2012
$122
$106
$89
48 ROGERS COMMUNICATIONS INC. 2014 ANNUAL REPORT