Rogers 2014 Annual Report Download - page 56
Download and view the complete annual report
Please find page 56 of the 2014 Rogers annual report below. You can navigate through the pages in the report by either clicking on the pages listed below, or by using the keyword search tool below to find specific information within the annual report.-
 1
1 -
2
-
3
-
4
-
5
-
6
-
7
-
8
-
9
-
10
-
11
-
12
-
13
-
14
-
15
-
16
-
17
-
18
-
19
-
20
-
21
-
22
-
23
-
24
-
25
-
26
-
27
-
28
-
29
-
30
-
31
-
32
-
33
-
34
-
35
-
36
-
37
-
38
-
39
-
40
-
41
-
42
-
43
-
44
-
45
-
 46
46 -
 47
47 -
 48
48 -
 49
49 -
 50
50 -
 51
51 -
 52
52 -
 53
53 -
 54
54 -
 55
55 -
 56
56 -
 57
57 -
 58
58 -
 59
59 -
 60
60 -
 61
61 -
 62
62 -
 63
63 -
 64
64 -
 65
65 -
 66
66 -
67
-
68
-
69
-
70
-
71
-
72
-
73
-
74
-
75
-
76
-
77
-
78
-
79
-
80
-
81
-
82
-
83
-
84
-
85
-
86
-
87
-
88
-
89
-
90
-
91
-
92
-
93
-
94
-
95
-
96
-
97
-
98
-
99
-
100
-
101
-
102
-
103
-
104
-
105
-
106
-
107
-
108
-
109
-
110
-
111
-
112
-
113
-
114
-
115
-
116
-
117
-
118
-
119
-
120
-
121
-
122
-
123
-
124
-
125
-
126
-
127
-
128
-
129
-
130
-
131
-
132
-
133
-
134
-
135
-
136
-
137
-
138
-
139
-
140
 |
 |

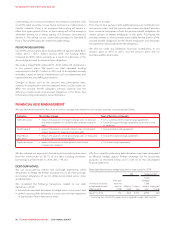
MANAGEMENT’S DISCUSSION AND ANALYSIS
2008 and 2013 where foreign exchange rates on the related debt
derivatives were updated to then current rates.
Foreign exchange losses recognized in 2013 are primarily from the
revaluation of US$350 million of senior notes due in 2038, for which
the associated debt derivatives had not been designated as hedges
for accounting purposes prior to March 6, 2013. Much of this foreign
exchange loss was offset by the corresponding change in the fair value
of the associated debt derivatives. During 2014, all of our US dollar-
denominated debt was hedged for accounting purposes.
See “Managing our Liquidity and Financial Resources” for more
information about our debt and related finance costs.
OTHER (EXPENSE) INCOME
Other (expense) income decreased this year due to lower investment
income from certain investments in associates and joint ventures and a
$47 million gain realized on the sale of our investment in TVtropolis in
2013.
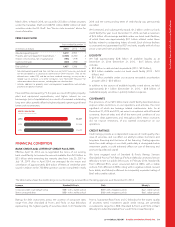
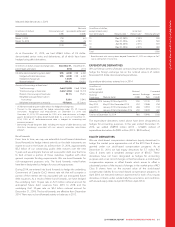
INCOME TAXES
The table below shows the difference between income taxes
computed by applying the statutory income tax rate to income before
income taxes and the actual income tax expense for the year:
Years ended December 31
(In millions of dollars, except tax rates) 2014 2013
Statutory income tax rate 26.5% 26.5%
Income before income taxes 1,847 2,265
Computed income tax expense 489 600
Increase (decrease) in income taxes resulting from:
Non-taxable portion of capital gains (1) (9)
Recognition of previously unrecognized
deferred tax assets —(14)
(Non-taxable) non-deductible stock-based
compensation (2) 8
Income tax adjustment, legislative tax change 14 8
Other items 63
Total income taxes 506 596
Effective income tax rate 27.4% 26.3%
Cash income taxes paid 460 496
Our effective income tax rate this year was 27.4% compared to 26.3%
for 2013. The effective income tax rate for 2014 differed from the
statutory tax rate primarily due to an adjustment to prior period
Ontario harmonization transitional tax credits of $14 million. Excluding
this adjustment, our effective income tax rate this year would have
been 26.6%.
Cash income taxes paid this year decreased as a result of the timing of
installment payments.
In 2011, legislative changes eliminated the deferral of partnership
income, accelerating the payment of approximately $700 million of
previously deferred cash taxes over a five year amortization period,
beginning in 2012 at 15%, 20% in each of 2013 through 2015, and
25% in 2016. Our cash income tax payments for the 2015 to 2016
taxation years will continue to include these additional amounts. While
the elimination of the deferral of partnership income affects the timing
of cash tax payments, it does not affect our income taxes for
accounting purposes. See “About Forward-Looking Information”.
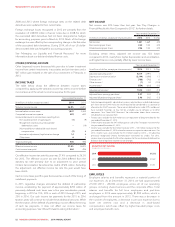
NET INCOME
Net income was 20% lower than last year. See “Key Changes in
Financial Results this Year Compared to 2013”, for further details.
Years ended December 31
(In millions of dollars, except per share amounts) 2014 2013 % Chg
Net income 1,341 1,669 (20)
Basic earnings per share 2.60 3.24 (20)
Diluted earnings per share 2.56 3.22 (20)
Excluding certain items, adjusted net income was 13% lower
compared to 2013, mainly from higher depreciation and amortization,
and higher finance costs, partially offset by lower income taxes.
Years ended December 31
(In millions of dollars, except per share amounts) 2014 2013 % Chg
Adjusted operating profit 15,019 4,993 1
Depreciation and amortization (2,144) (1,898) 13
Finance costs 2(788) (742) 6
Other income 3(1) 34 (103)
Income taxes 4(554) (618) (10)
Adjusted net income 11,532 1,769 (13)
Adjusted basic earnings per share 12.97 3.43 (13)
Adjusted diluted earnings per share 12.96 3.42 (13)
1Adjusted operating profit, adjusted net income, adjusted basic and diluted earnings
per share are non-GAAP measures and should not be considered as a substitute or
alternative for GAAP measures. These are not defined terms under IFRS, and do not
have standard meanings, so may not be a reliable way to compare us to other
companies. See “Non-GAAP Measures” for information about these measures,
including how we calculate them.
2Finance costs exclude the $29 million loss on repayment of long-term debt for the
year ended December 31, 2014.
3Other income excludes the $47 million gain on sale of the TVtropolis investment for
the year ended December 31, 2013.
4Income taxes exclude the $62 million recovery (2013 — $30 million recovery) for the
year ended December 31, 2014 related to income tax impact for adjusted items. For
2014, income taxes also exclude the $14 million expense (2013 — nil) adjusting
previously recognized Ontario harmonization transitional tax credits. For 2013,
income taxes also exclude the $8 million expense for the revaluation of deferred tax
balances due to legislative income tax rate changes.
(IN MILLIONS OF DOLLARS)
ADJUSTED NET INCOME
2014
2013
2012
$1,532
$1,769
$1,781
EMPLOYEES
Employee salaries and benefits represent a material portion of
our expenses. As at December 31, 2014, we had approximately
27,000 (2013 – 28,000) employees across all of our operating
groups, including shared services and the corporate office. Total
salaries and benefits for full time employees and part-time
employees in 2014 were approximately $1,940 million, which is
unchanged from the amount in 2013. There was a decrease in
the number of employees, a decrease in pension expense due to
lower net interest cost and a decrease in stock-based
compensation, which was offset by higher baseball player costs
and employee benefit costs.
52 ROGERS COMMUNICATIONS INC. 2014 ANNUAL REPORT