Rogers 2014 Annual Report Download - page 32
Download and view the complete annual report
Please find page 32 of the 2014 Rogers annual report below. You can navigate through the pages in the report by either clicking on the pages listed below, or by using the keyword search tool below to find specific information within the annual report.-
 1
1 -
2
-
3
-
4
-
5
-
6
-
7
-
8
-
9
-
10
-
11
-
12
-
13
-
14
-
15
-
16
-
17
-
18
-
19
-
20
-
21
-
 22
22 -
 23
23 -
 24
24 -
 25
25 -
 26
26 -
 27
27 -
 28
28 -
 29
29 -
 30
30 -
 31
31 -
 32
32 -
 33
33 -
 34
34 -
 35
35 -
 36
36 -
 37
37 -
 38
38 -
 39
39 -
 40
40 -
 41
41 -
 42
42 -
43
-
44
-
45
-
46
-
47
-
48
-
49
-
50
-
51
-
52
-
53
-
54
-
55
-
56
-
57
-
58
-
59
-
60
-
61
-
62
-
63
-
64
-
65
-
66
-
67
-
68
-
69
-
70
-
71
-
72
-
73
-
74
-
75
-
76
-
77
-
78
-
79
-
80
-
81
-
82
-
83
-
84
-
85
-
86
-
87
-
88
-
89
-
90
-
91
-
92
-
93
-
94
-
95
-
96
-
97
-
98
-
99
-
100
-
101
-
102
-
103
-
104
-
105
-
106
-
107
-
108
-
109
-
110
-
111
-
112
-
113
-
114
-
115
-
116
-
117
-
118
-
119
-
120
-
121
-
122
-
123
-
124
-
125
-
126
-
127
-
128
-
129
-
130
-
131
-
132
-
133
-
134
-
135
-
136
-
137
-
138
-
139
-
140
 |
 |
MANAGEMENT’S DISCUSSION AND ANALYSIS
KEY ACHIEVEMENTS
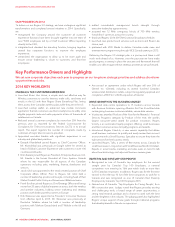
OPERATING REVENUE AND ADJUSTED OPERATING PROFIT
• Consolidated revenue increased by 1% this year, reflecting revenue
growth of 2% in Business Solutions and 7% in Media, while Wireless
and Cable revenue was stable. Wireless revenue was stable with the
impact of continued adoption of the customer-friendly Rogers Share
Everything Plans, which generate higher ARPU, offset by lower roaming
revenue. Cable revenue was stable as the increase in Internet revenue
was offset by decreases in Television and Phone revenue. Media
revenue increased as a result of the National Hockey League (NHL)
licensing agreement, growth at Sportsnet, and higher revenues at The
Shopping Channel, the Toronto Blue Jays, and Radio, partially offset by
continued softness in conventional broadcast TV and print advertising.
• Consolidated adjusted operating profit increased 1% this year to
$5,019 million, with consolidated adjusted operating profit margins
of 39.1%, resulting from higher revenue offset by higher operating
expenses in Cable and Media. Our net income decreased 20% to
$1,341 million, mainly due to higher depreciation and amortization,
restructuring, acquisition and other and finance costs.
• We activated 2.6 million wireless smartphones, of which 30% were
new subscribers, with higher-value smartphone customers growing
to represent 84% of Wireless postpaid subscribers.
FREE CASH FLOW
• Free cash flow decreased 7% this year to $1,437 million as a
result of higher property, plant and equipment expenditures
and higher interest on our borrowings, partially offset by
higher adjusted operating profit and lower cash income taxes.
Similarly, our cash provided by operating activities decreased
7% this year to $3,698 million.
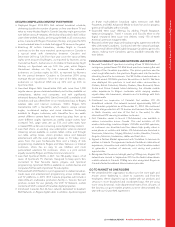
BALANCE SHEET AND LIQUIDITY POSITION
• Issued $2.1 billion of senior notes at historically low rates for Rogers,
consisting of $250 million three year floating rate senior notes,
$400 million five year 2.80% senior notes, $600 million ten year
4.00% senior notes, and US$750 million ($832 million) thirty year
5.00% senior notes.
• Our overall weighted average cost of borrowings was 5.20% as at
December 31, 2014 compared to 5.54% as at December 31, 2013,
and a weighted average term to maturity of 10.8 years, compared to
10.3 years as at December 31, 2013.
• Ended the year with approximately $2.8 billion of available liquidity,
comprised of $0.2 billion cash on hand, $2.5 billion available under
our bank credit facility and $0.1 billion available under our $0.9
billion accounts receivable securitization program.
GROWING DIVIDENDS
• Increased our annualized dividend rate in February 2014 by 5% to
$1.83 per Class A Voting and Class B Non-Voting share and paid a
quarterly dividend of $0.4575 per share during 2014. The Rogers
Board of Directors further authorized an increase in our annualized
dividend on January 28, 2015, by 5% to $1.92.
NEW STRATEGIC PLAN
• Unveiled Rogers 3.0, a multi-year, seven-point plan in May 2014 that
reflects feedback from thousands of customers, employees,
shareholders and a number of other stakeholders. The plan builds
on Rogers unrivaled asset mix and the underlying strengths of the
Company to improve customer experience, reaccelerate growth
and better capitalize on opportunities for growth and innovation.
• Completed a structural reorganization under the Rogers 3.0 plan to
enhance service, accountability and agility by structuring teams
around our customers and removing management layers to ensure
that senior leadership is closer to customers and front-line
employees. We hired executive leaders with significant experience
to fill key senior management roles and have begun executing our
new Rogers 3.0 plan.
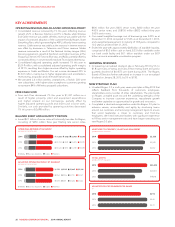
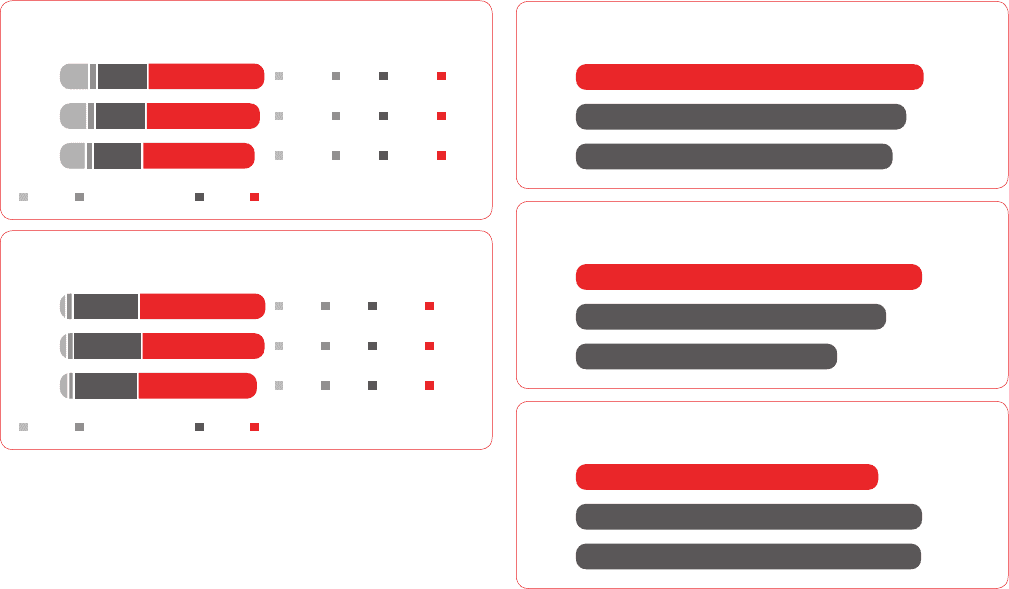
(IN MILLIONS OF DOLLARS)
OPERATING REVENUE BY SEGMENT
2014
2013
2012
$1,826 $382 $3,467 $7,305
$1,704 $374 $3,475 $7,270
$1,620 $351 $3,358 $7,280
WirelessCableBusiness SolutionsMedia
(IN MILLIONS OF DOLLARS)
ADJUSTED OPERATING PROFIT BY SEGMENT
2014
2013
2012
$131 $122 $1,665 $3,246
$161 $106 $1,718 $3,157
$190 $89 $1,605 $3,063
WirelessCableBusiness SolutionsMedia
(IN MILLIONS OF DOLLARS)
ADDITIONS TO PROPERTY, PLANT AND EQUIPMENT
2014
2013
2012
$2,366
$2,240
$2,142
(IN MILLIONS OF DOLLARS)
TOTAL ASSETS
2014
2013
2012
$26,522
$23,601
$19,618
($)
ADJUSTED DILUTED EARNINGS PER SHARE
2014
2013
2012
$2.96
$3.42
$3.41
28 ROGERS COMMUNICATIONS INC. 2014 ANNUAL REPORT