Rogers 2014 Annual Report Download - page 51
Download and view the complete annual report
Please find page 51 of the 2014 Rogers annual report below. You can navigate through the pages in the report by either clicking on the pages listed below, or by using the keyword search tool below to find specific information within the annual report.-
 1
1 -
2
-
3
-
4
-
5
-
6
-
7
-
8
-
9
-
10
-
11
-
12
-
13
-
14
-
15
-
16
-
17
-
18
-
19
-
20
-
21
-
22
-
23
-
24
-
25
-
26
-
27
-
28
-
29
-
30
-
31
-
32
-
33
-
34
-
35
-
36
-
37
-
38
-
39
-
40
-
 41
41 -
 42
42 -
 43
43 -
 44
44 -
 45
45 -
 46
46 -
 47
47 -
 48
48 -
 49
49 -
 50
50 -
 51
51 -
 52
52 -
 53
53 -
 54
54 -
 55
55 -
 56
56 -
 57
57 -
 58
58 -
 59
59 -
 60
60 -
 61
61 -
62
-
63
-
64
-
65
-
66
-
67
-
68
-
69
-
70
-
71
-
72
-
73
-
74
-
75
-
76
-
77
-
78
-
79
-
80
-
81
-
82
-
83
-
84
-
85
-
86
-
87
-
88
-
89
-
90
-
91
-
92
-
93
-
94
-
95
-
96
-
97
-
98
-
99
-
100
-
101
-
102
-
103
-
104
-
105
-
106
-
107
-
108
-
109
-
110
-
111
-
112
-
113
-
114
-
115
-
116
-
117
-
118
-
119
-
120
-
121
-
122
-
123
-
124
-
125
-
126
-
127
-
128
-
129
-
130
-
131
-
132
-
133
-
134
-
135
-
136
-
137
-
138
-
139
-
140
 |
 |

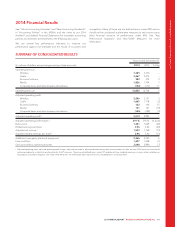
MANAGEMENT’S DISCUSSION AND ANALYSIS
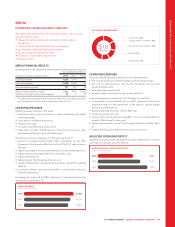
OPERATING REVENUE
Internet revenue includes:
• monthly subscription and additional use service revenues from
residential, small business and wholesale Internet access
subscribers; and
• modem rental fees.
Television revenue includes:
• digital cable services – includes digital channel service fees,
including premium and specialty service subscription fees, pay per
view service fees and video on demand service fees;
• analog cable services – includes basic cable service fees plus
extended basic (or tier) service fees and access fees for use of
channel capacity by third parties; and
• rental and sale of digital cable set-top terminals.
Phone revenue includes revenues from residential and small business
local telephony service from:
• monthly service fees;
• calling features such as voicemail and call waiting and caller ID; and
• long-distance calling.
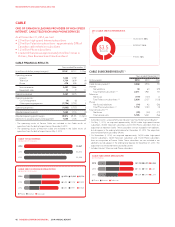
Total operating revenue was consistent this year primarily as a result of:
• a higher subscriber base for our Internet products combined with
the movement of more customers to higher-end speed and usage
tiers; and
• the May 2013 acquisition of Mountain Cable and November 2014
acquisition of Source Cable; offset by
• Television subscriber losses over the past year; and
• lower Phone revenue from retention and promotional-related
discounting.
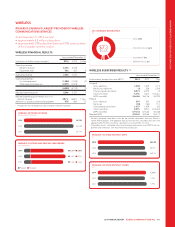
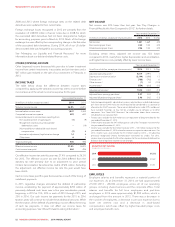
Internet revenue
Internet revenue increased by 7% this year as a result of:
• a larger Internet subscriber base;
• general movement by customers to higher-end speed and usage
tiers; and
• increases in Internet service pricing.
2014
2013
2012
2,011
1,961
1,864
49%
49%
49%
(IN THOUSANDS)
INTERNET SUBSCRIBERS AND INTERNET
PENETRATION OF HOMES PASSED %
Television revenue
Television revenue decreased by 4% this year as a result of the:
• decline in Television subscribers over the past year associated with
heightened pay TV competition; partially offset by
• impact of pricing increases implemented over the past year; and
• acquisitions of Mountain Cable and Source Cable.
The digital cable subscriber base represented 88% of our total
Television subscriber base as at the end of 2014, compared to 84% at
the end of 2013. The larger selection of digital content, video on-
demand, and HDTV and PVR equipment combined with our ongoing
analog to digital network conversion continue to contribute to the
increasing penetration of digital as a percentage of our total Television
subscriber base.
Phone revenue
Phone revenue decreased by 4% this year as a result of:
• increased retention and promotional-related discounting associated
with greater competition and multi-product bundles; partially offset
by
• a higher average Phone subscriber base throughout the year; and
• the impact of pricing increases implemented over the past year.
2014
2013
2012
1,150
1,153
1,074
28%
29%
28%
(IN THOUSANDS)
PHONE SUBSCRIBERS AND PHONE PENETRATION
OF HOMES PASSED %
Equipment sales
Equipment sales include revenues generated from the sale of digital
cable set-top terminals and Internet modems.
Revenuefromequipmentsalesincreasedby11%thisyearasaresult
of an increase in cable box sales versus the prior year.
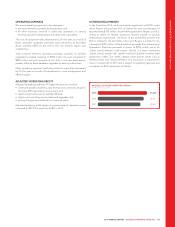
OPERATING EXPENSES
We assess Cable operating expenses in three categories:
• the cost of programming;
• the cost of equipment sales (cable digital set-top box and Internet
modem equipment); and
• all other expenses involved in day-to-day operations, to service and
retain existing subscriber relationships and attract new subscribers.
Operating expenses increased by 3% this year as a result of:
• incremental costs associated with the Mountain Cable and Source
Cable acquisitions;
• higher investments in customer careandnetworkandcustomer
value enhancement related costs; and
• $5 million impact of a one-time cumulative Local Program
Improvement Fund adjustment relating to a CRTC ruling this year
and an $8 million positive adjustment in 2013 to licence fees
payable to match the CRTC’s billing period; partially offset by
• various cost efficiency and productivity initiatives.
ADJUSTED OPERATING PROFIT
Adjusted operating profit decreased by 3% this year as a result of
higher operating expenses, as described above. The Source Cable
acquisition did not have a significant impact on adjusted operating
profit this year.
(IN MILLIONS OF DOLLARS)
CABLE ADJUSTED OPERATING PROFIT
AND CABLE ADJUSTED PROFIT MARGIN %
2014
2013
2012
$1,665
$1,718
$1,605
48.0%
49.4%
47.8%
CABLE ACQUISITION
On November 4, 2014, we acquired Source Cable Limited, a small
television, Internet, and phone service provider for $156 million. The
Source Cable footprint is situated adjacent to existing Rogers cable
systems in Southwestern Ontario and is expected to enable numerous
synergies.
2014 ANNUAL REPORT ROGERS COMMUNICATIONS INC. 47