Rogers 2014 Annual Report Download - page 88
Download and view the complete annual report
Please find page 88 of the 2014 Rogers annual report below. You can navigate through the pages in the report by either clicking on the pages listed below, or by using the keyword search tool below to find specific information within the annual report.-
 1
1 -
2
-
3
-
4
-
5
-
6
-
7
-
8
-
9
-
10
-
11
-
12
-
13
-
14
-
15
-
16
-
17
-
18
-
19
-
20
-
21
-
22
-
23
-
24
-
25
-
26
-
27
-
28
-
29
-
30
-
31
-
32
-
33
-
34
-
35
-
36
-
37
-
38
-
39
-
40
-
41
-
42
-
43
-
44
-
45
-
46
-
47
-
48
-
49
-
50
-
51
-
52
-
53
-
54
-
55
-
56
-
57
-
58
-
59
-
60
-
61
-
62
-
63
-
64
-
65
-
66
-
67
-
68
-
69
-
70
-
71
-
72
-
73
-
74
-
75
-
76
-
77
-
 78
78 -
 79
79 -
 80
80 -
 81
81 -
 82
82 -
 83
83 -
 84
84 -
 85
85 -
 86
86 -
 87
87 -
 88
88 -
 89
89 -
 90
90 -
 91
91 -
 92
92 -
 93
93 -
 94
94 -
 95
95 -
 96
96 -
 97
97 -
 98
98 -
99
-
100
-
101
-
102
-
103
-
104
-
105
-
106
-
107
-
108
-
109
-
110
-
111
-
112
-
113
-
114
-
115
-
116
-
117
-
118
-
119
-
120
-
121
-
122
-
123
-
124
-
125
-
126
-
127
-
128
-
129
-
130
-
131
-
132
-
133
-
134
-
135
-
136
-
137
-
138
-
139
-
140
 |
 |

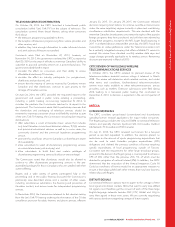
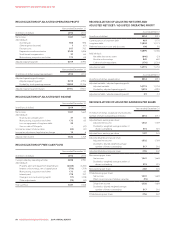
MANAGEMENT’S DISCUSSION AND ANALYSIS
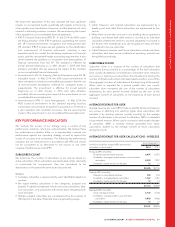
RECONCILIATION OF ADJUSTED OPERATING PROFIT
Years ended December 31
(In millions of dollars) 2014 2013
Net income 1,341 1,669
Add (deduct):
Income taxes 506 596
Other expense (income) 1(81)
Finance costs 817 742
Depreciation and amortization 2,144 1,898
Stock-based compensation 37 84
Restructuring, acquisition and other 173 85
Adjusted operating profit 5,019 4,993
Years ended December 31
(In millions of dollars, except percentages) 2014 2013
Adjusted operating profit margin:
Adjusted operating profit 5,019 4,993
Divided by: total operating revenue 12,850 12,706
Adjusted operating profit margin 39.1% 39.3%
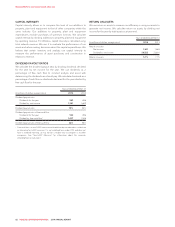
RECONCILIATION OF ADJUSTED NET INCOME
Years ended December 31
(In millions of dollars) 2014 2013
Net income 1,341 1,669
Add (deduct):
Stock-based compensation 37 84
Restructuring, acquisition and other 173 85
Loss on repayment of long-term debt 29 —
Gain on sale of TVtropolis —(47)
Income tax impact of above items (62) (30)
Income tax adjustment, legislative tax change 14 8
Adjusted net income 1,532 1,769
RECONCILIATION OF FREE CASH FLOW
Years ended December 31
(In millions of dollars) 2014 2013
Cash provided by operating activities 3,698 3,990
Add (deduct):
Property, plant and equipment expenditures (2,366) (2,240)
Interest on borrowings, net of capitalization (756) (709)
Restructuring, acquisition and other 173 85
Interest paid 778 700
Change in non-cash working capital (11) (238)
Other adjustments (79) (40)
Free cash flow 1,437 1,548
RECONCILIATION OF ADJUSTED NET DEBT AND
ADJUSTED NET DEBT / ADJUSTED OPERATING PROFIT
As at December 31
(In millions of dollars) 2014 2013
Current portion of long-term debt 963 1,170
Long-term debt 13,824 12,173
Deferred transaction costs and discounts 108 93
14,895 13,436
Add (deduct):
Net debt derivatives assets (846) (51)
Short-term borrowings 842 650
Cash and cash equivalents (176) (2,301)
Adjusted net debt 14,715 11,734
As at December 31
(In millions of dollars, except ratios) 2014 2013
Adjusted net debt / adjusted operating profit:
Adjusted net debt 14,715 11,734
Divided by: adjusted operating profit 5,019 4,993
Adjusted net debt / adjusted operating profit 2.9 2.4
RECONCILIATION OF ADJUSTED EARNINGS PER SHARE
Years ended December 31
(In millions of dollars, except per share amounts;
number of shares outstanding in millions) 2014 2013
Adjusted basic earnings per share:
Adjusted net income 1,532 1,769
Divided by: weighted average number of
shares outstanding 515 515
Adjusted basic earnings per share 2.97 3.43
Adjusted diluted earnings per share:
Adjusted net income 1,532 1,769
Dividedby:dilutedweightedaverage
number of shares outstanding 517 518
Adjusted diluted earnings per share 2.96 3.42
Basic earnings per share:
Net income 1,341 1,669
Divided by: weighted average number of
shares outstanding 515 515
Basic earnings per share 2.60 3.24
Diluted earnings per share:
Net income 1,341 1,669
Effect on net income of dilutive securities (15) —
Diluted net income 1,326 1,669
Dividedby:dilutedweightedaverage
number of shares outstanding 517 518
Diluted earnings per share 2.56 3.22
84 ROGERS COMMUNICATIONS INC. 2014 ANNUAL REPORT