Rogers 2014 Annual Report Download - page 95
Download and view the complete annual report
Please find page 95 of the 2014 Rogers annual report below. You can navigate through the pages in the report by either clicking on the pages listed below, or by using the keyword search tool below to find specific information within the annual report.-
 1
1 -
2
-
3
-
4
-
5
-
6
-
7
-
8
-
9
-
10
-
11
-
12
-
13
-
14
-
15
-
16
-
17
-
18
-
19
-
20
-
21
-
22
-
23
-
24
-
25
-
26
-
27
-
28
-
29
-
30
-
31
-
32
-
33
-
34
-
35
-
36
-
37
-
38
-
39
-
40
-
41
-
42
-
43
-
44
-
45
-
46
-
47
-
48
-
49
-
50
-
51
-
52
-
53
-
54
-
55
-
56
-
57
-
58
-
59
-
60
-
61
-
62
-
63
-
64
-
65
-
66
-
67
-
68
-
69
-
70
-
71
-
72
-
73
-
74
-
75
-
76
-
77
-
78
-
79
-
80
-
81
-
82
-
83
-
84
-
 85
85 -
 86
86 -
 87
87 -
 88
88 -
 89
89 -
 90
90 -
 91
91 -
 92
92 -
 93
93 -
 94
94 -
 95
95 -
 96
96 -
 97
97 -
 98
98 -
 99
99 -
 100
100 -
 101
101 -
 102
102 -
 103
103 -
 104
104 -
 105
105 -
106
-
107
-
108
-
109
-
110
-
111
-
112
-
113
-
114
-
115
-
116
-
117
-
118
-
119
-
120
-
121
-
122
-
123
-
124
-
125
-
126
-
127
-
128
-
129
-
130
-
131
-
132
-
133
-
134
-
135
-
136
-
137
-
138
-
139
-
140
 |
 |

CONSOLIDATED FINANCIAL STATEMENTS
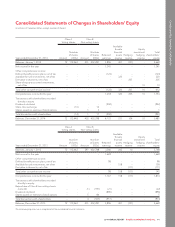
Consolidated Statements of Changes in Shareholders’ Equity
(In millions of Canadian dollars, except number of shares)
Class A
Voting shares
Class B
Non-voting shares
Year ended December 31, 2014 Amount
Number
of shares
(000s) Amount
Number
of shares
(000s)
Retained
earnings
Available-
for-sale
financial
assets
reserve
Hedging
reserve
Equity
investment
hedging
reserve
Total
shareholders’
equity
Balances, January 1, 2014 72 112,462 401 402,281 3,896 401 (101) – 4,669
Net income for the year – – – – 1,341 – – – 1,341
Other comprehensive income:
Defined benefit pension plans, net of tax – – – – (123) – – – (123)
Available-for-sale investments, net of tax – – – – – 320 – – 320
Derivative instruments, net of tax – – – – – – 205 – 205
Share of equity-accounted investments,
netoftax –– –– – –– 10 10
Total other comprehensive income – – – – (123) 320 205 10 412
Comprehensive income for the year – – – – 1,218 320 205 10 1,753
Transactions with shareholders recorded
directly in equity:
Dividends declared – – – – (942) – – – (942)
Share class exchange – (14) – 14 – – – – –
Shares issued on exercise of stock options – – 1 3 – – – – 1
Total transactions with shareholders – (14) 1 17 (942) – – – (941)
Balances, December 31, 2014 72 112,448 402 402,298 4,172 721 104 10 5,481
Class A
Voting shares
Class B
Non-voting shares
Year ended December 31, 2013 Amount
Number
of shares
(000s) Amount
Number
of shares
(000s)
Retained
earnings
Available-
for-sale
financial
assets
reserve
Hedging
reserve
Equity
investment
hedging
reserve
Total
shareholders’
equity
Balances, January 1, 2013 72 112,462 397 402,788 3,046 243 10 – 3,768
Net income for the year – – – – 1,669 – – – 1,669
Other comprehensive income:
Defined benefit pension plans, net of tax – – – – 98 – – – 98
Available-for-sale investments, net of tax – – – – – 158 – – 158
Derivative instruments, net of tax – – – – – – (111) – (111)
Total other comprehensive income – – – – 98 158 (111) – 145
Comprehensive income for the year – – – – 1,767 158 (111) – 1,814
Transactions with shareholders recorded
directly in equity:
Repurchase of Class B non-voting shares
(note 24) – – (1) (591) (21) – – – (22)
Dividends declared – – – – (896) – – – (896)
Shares issued on exercise of stock options – – 5 84 – – – – 5
Total transactions with shareholders – – 4 (507) (917) – – – (913)
Balances, December 31, 2013 72 112,462 401 402,281 3,896 401 (101) – 4,669
The accompanying notes are an integral part of the consolidated financial statements.
2014 ANNUAL REPORT ROGERS COMMUNICATIONS INC. 91