Rogers 2014 Annual Report Download - page 112
Download and view the complete annual report
Please find page 112 of the 2014 Rogers annual report below. You can navigate through the pages in the report by either clicking on the pages listed below, or by using the keyword search tool below to find specific information within the annual report.-
 1
1 -
2
-
3
-
4
-
5
-
6
-
7
-
8
-
9
-
10
-
11
-
12
-
13
-
14
-
15
-
16
-
17
-
18
-
19
-
20
-
21
-
22
-
23
-
24
-
25
-
26
-
27
-
28
-
29
-
30
-
31
-
32
-
33
-
34
-
35
-
36
-
37
-
38
-
39
-
40
-
41
-
42
-
43
-
44
-
45
-
46
-
47
-
48
-
49
-
50
-
51
-
52
-
53
-
54
-
55
-
56
-
57
-
58
-
59
-
60
-
61
-
62
-
63
-
64
-
65
-
66
-
67
-
68
-
69
-
70
-
71
-
72
-
73
-
74
-
75
-
76
-
77
-
78
-
79
-
80
-
81
-
82
-
83
-
84
-
85
-
86
-
87
-
88
-
89
-
90
-
91
-
92
-
93
-
94
-
95
-
96
-
97
-
98
-
99
-
100
-
101
-
 102
102 -
 103
103 -
 104
104 -
 105
105 -
 106
106 -
 107
107 -
 108
108 -
 109
109 -
 110
110 -
 111
111 -
 112
112 -
 113
113 -
 114
114 -
 115
115 -
 116
116 -
 117
117 -
 118
118 -
 119
119 -
 120
120 -
 121
121 -
 122
122 -
123
-
124
-
125
-
126
-
127
-
128
-
129
-
130
-
131
-
132
-
133
-
134
-
135
-
136
-
137
-
138
-
139
-
140
 |
 |

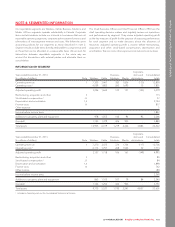
NOTES TO CONSOLIDATED FINANCIAL STATEMENTS
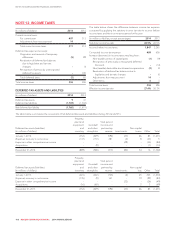
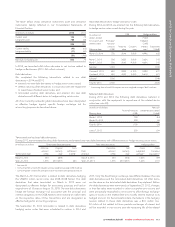
NOTE 12: INCOME TAXES
(In millions of dollars) 2014 2013
Current income taxes:
For current year 497 513
Adjustments from reassessment 14 –
Total current income taxes 511 513
Deferred tax expense (recovery):
Origination and reversal of temporary
differences (5) 89
Revaluation of deferred tax balances
due to legislative and tax rate
changes –8
Recognition of previously unrecognized
deferred tax assets –(14)
Total deferred taxes (5) 83
Total income taxes 506 596
DEFERRED TAX ASSETS AND LIABILITIES
(In millions of dollars) 2014 2013
Deferred tax assets 931
Deferred tax liabilities (1,769) (1,702)
Net deferred tax liability (1,760) (1,671)
The table below shows the difference between income tax expense
computed by applying the statutory income tax rate to income before
income taxes and the income tax expense for the year.
(In millions of dollars, except percentages) 2014 2013
Statutory income tax rate 26.5% 26.5%
Income before income taxes 1,847 2,265
Computed income tax expense 489 600
Increase (decrease) in income taxes resulting from:
Non-taxable portion of capital gains (1) (9)
Recognition of previously unrecognized deferred
tax assets –(14)
Non-(taxable) deductible stock-based compensation (2) 8
Revaluation of deferred tax balances due to
legislativeandtaxratechanges –8
Adjustments from reassessment 14 –
Other items 63
Total income taxes 506 596
Effective income tax rate 27.4% 26.3%
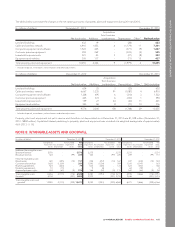
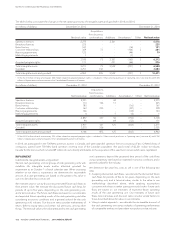
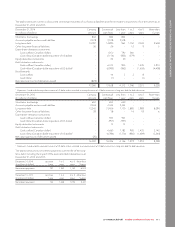
The table below summarizes the movement of net deferred tax assets and liabilities during 2014 and 2013.
Deferred tax assets (liabilities)
(In millions of dollars)
Property,
plant and
equipment
and
inventory
Goodwill
and other
intangibles
Stub period
income and
partnership
reserve Investments
Non-capital
losses Other Total
January 1, 2014 (752) (429) (594) (27) 46 85 (1,671)
(Expense) recovery in net income (137) (110) 281 (4) 8 (33) 5
Expense in other comprehensive income – – – (49) – (35) (84)
Acquisitions – (9) – – – (1) (10)
December 31, 2014 (889) (548) (313) (80) 54 16 (1,760)
Deferred tax assets (liabilities)
(In millions of dollars)
Property,
plant and
equipment
and
inventory
Goodwill
and other
intangibles
Stub period
income and
partnership
reserve Investments
Non-capital
loss Other Total
January 1, 2013 (601) (360) (735) (4) 25 205 (1,470)
(Expense) recovery in net income (135) (9) 141 – 19 (99) (83)
Expense in other comprehensive income – – – (23) – (26) (49)
Acquisitions (16) (60) – – 2 5 (69)
December 31, 2013 (752) (429) (594) (27) 46 85 (1,671)
108 ROGERS COMMUNICATIONS INC. 2014 ANNUAL REPORT