Pizza Hut 2011 Annual Report Download - page 91
Download and view the complete annual report
Please find page 91 of the 2011 Pizza Hut annual report below. You can navigate through the pages in the report by either clicking on the pages listed below, or by using the keyword search tool below to find specific information within the annual report.-
 1
1 -
2
-
3
-
4
-
5
-
6
-
7
-
8
-
9
-
10
-
11
-
12
-
13
-
14
-
15
-
16
-
17
-
18
-
19
-
20
-
21
-
22
-
23
-
24
-
25
-
26
-
27
-
28
-
29
-
30
-
31
-
32
-
33
-
34
-
35
-
36
-
37
-
38
-
39
-
40
-
41
-
42
-
43
-
44
-
45
-
46
-
47
-
48
-
49
-
50
-
51
-
52
-
53
-
54
-
55
-
56
-
57
-
58
-
59
-
60
-
61
-
62
-
63
-
64
-
65
-
66
-
67
-
68
-
69
-
70
-
71
-
72
-
73
-
74
-
75
-
76
-
77
-
78
-
79
-
80
-
 81
81 -
 82
82 -
 83
83 -
 84
84 -
 85
85 -
 86
86 -
 87
87 -
 88
88 -
 89
89 -
 90
90 -
 91
91 -
 92
92 -
 93
93 -
 94
94 -
 95
95 -
 96
96 -
 97
97 -
 98
98 -
 99
99 -
 100
100 -
 101
101 -
102
-
103
-
104
-
105
-
106
-
107
-
108
-
109
-
110
-
111
-
112
-
113
-
114
-
115
-
116
-
117
-
118
-
119
-
120
-
121
-
122
-
123
-
124
-
125
-
126
-
127
-
128
-
129
-
130
-
131
-
132
-
133
-
134
-
135
-
136
-
137
-
138
-
139
-
140
-
141
-
142
-
143
-
144
-
145
-
146
-
147
-
148
-
149
-
150
-
151
-
152
-
153
-
154
-
155
-
156
-
157
-
158
-
159
-
160
-
161
-
162
-
163
-
164
-
165
-
166
-
167
-
168
-
169
-
170
-
171
-
172
-
173
-
174
-
175
-
176
-
177
-
178
-
179
-
180
-
181
-
182
-
183
-
184
-
185
-
186
-
187
-
188
-
189
-
190
-
191
-
192
-
193
-
194
-
195
-
196
-
197
-
198
-
199
-
200
-
201
-
202
-
203
-
204
-
205
-
206
-
207
-
208
-
209
-
210
-
211
-
212
 |
 |

16MAR201218542623
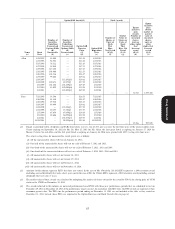
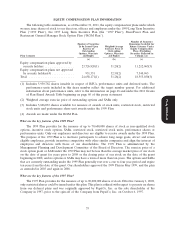
DIRECTOR COMPENSATION
As described more fully below, this table summarizes compensation paid to each non-employee
director during 2011.
Fees
Earned or Stock Option/SAR All Other
Paid in Awards Awards Compensation
Name Cash ($) ($)(1) ($)(2)(3) ($)(4) Total ($)
(a) (b) (c) (d) (e) (f)
Dorman, David ...................... 170,000 36,239 — 206,239
Ferragamo, Massimo ................... 170,000 36,239 — 206,239
Grissom, David ...................... 190,000 36,239 — 226,239
Hill, Bonnie ......................... 85,000 85,000 36,239 3,500 209,739
Holland, Robert ...................... 170,000 36,239 — 206,239
Langone, Kenneth .................... 170,000 36,239 10,000 216,239
Linen, Jonathan ...................... 170,000 36,239 — 206,239
Nelson, Thomas ...................... 170,000 36,239 — 206,239
Ryan, Thomas ....................... 180,000 36,239 — 216,239
Walter, Robert ....................... 180,000 36,239 10,000 226,239
(1) Amounts in this column represent the grant date fair value for annual stock retainer awards granted
to directors in 2011.
(2) Amounts in this column represent the grant date fair value for annual SARs granted in fiscal 2011.
These amounts do not reflect amounts paid to or realized by the director for fiscal 2011. For a
discussion of the assumptions used to value the awards, see the discussion of stock awards and option
awards contained in Part II, Item 8, ‘‘Financial Statements and Supplementary Data’’ of the 2011
Annual Report in Notes to Consolidated Financial Statements at Note 15, ‘‘Share-based and Deferred
Compensation Plans.’’
(3) At December 31, 2011, the aggregate number of options and SARs awards outstanding for non-
Proxy Statement
management directors was:
Name Options SARs
Dorman, David ........................... 10,476 21,679
Ferragamo, Massimo ....................... 15,982 21,679
Grissom, David ........................... 15,470 21,679
Hill, Bonnie .............................. 15,176 21,679
Holland, Robert ........................... 15,982 21,679
Langone, Kenneth ......................... — 21,679
Linen, Jonathan ........................... 10,476 21,679
Nelson, Thomas ........................... — 26,859
Ryan, Thomas ............................ 19,414 21,679
Walter, Robert ............................ — 15,246
Mr. Novak’s and Mr. Su’s outstanding awards are set forth on page 62.
(4) Represents amount of matching charitable contributions made on behalf of the director under the
Company’s matching gift program and/or the amount charitable contribution made in the director’s
name.
The Company uses a combination of cash and stock-based incentive compensation to attract and
retain qualified candidates to serve on the Board. In setting director compensation, the Company
73