Pizza Hut 2011 Annual Report Download - page 197
Download and view the complete annual report
Please find page 197 of the 2011 Pizza Hut annual report below. You can navigate through the pages in the report by either clicking on the pages listed below, or by using the keyword search tool below to find specific information within the annual report.-
 1
1 -
2
-
3
-
4
-
5
-
6
-
7
-
8
-
9
-
10
-
11
-
12
-
13
-
14
-
15
-
16
-
17
-
18
-
19
-
20
-
21
-
22
-
23
-
24
-
25
-
26
-
27
-
28
-
29
-
30
-
31
-
32
-
33
-
34
-
35
-
36
-
37
-
38
-
39
-
40
-
41
-
42
-
43
-
44
-
45
-
46
-
47
-
48
-
49
-
50
-
51
-
52
-
53
-
54
-
55
-
56
-
57
-
58
-
59
-
60
-
61
-
62
-
63
-
64
-
65
-
66
-
67
-
68
-
69
-
70
-
71
-
72
-
73
-
74
-
75
-
76
-
77
-
78
-
79
-
80
-
81
-
82
-
83
-
84
-
85
-
86
-
87
-
88
-
89
-
90
-
91
-
92
-
93
-
94
-
95
-
96
-
97
-
98
-
99
-
100
-
101
-
102
-
103
-
104
-
105
-
106
-
107
-
108
-
109
-
110
-
111
-
112
-
113
-
114
-
115
-
116
-
117
-
118
-
119
-
120
-
121
-
122
-
123
-
124
-
125
-
126
-
127
-
128
-
129
-
130
-
131
-
132
-
133
-
134
-
135
-
136
-
137
-
138
-
139
-
140
-
141
-
142
-
143
-
144
-
145
-
146
-
147
-
148
-
149
-
150
-
151
-
152
-
153
-
154
-
155
-
156
-
157
-
158
-
159
-
160
-
161
-
162
-
163
-
164
-
165
-
166
-
167
-
168
-
169
-
170
-
171
-
172
-
173
-
174
-
175
-
176
-
177
-
178
-
179
-
180
-
181
-
182
-
183
-
184
-
185
-
186
-
 187
187 -
 188
188 -
 189
189 -
 190
190 -
 191
191 -
 192
192 -
 193
193 -
 194
194 -
 195
195 -
 196
196 -
 197
197 -
 198
198 -
 199
199 -
 200
200 -
 201
201 -
 202
202 -
 203
203 -
 204
204 -
 205
205 -
 206
206 -
 207
207 -
208
-
209
-
210
-
211
-
212
 |
 |

93
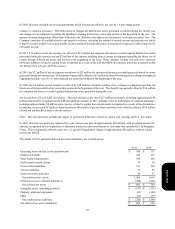
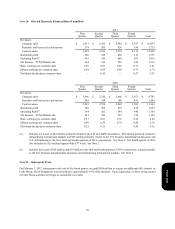
Note 20 – Selected Quarterly Financial Data (Unaudited)
Revenues:
Company sales
Franchise and license fees and income
Total revenues
Restaurant profit
Operating Profit(a)
Net Income – YUM! Brands, Inc.
Basic earnings per common share
Diluted earnings per common share
Dividends declared per common share
2011
First
Quarter
$ 2,051
374
2,425
360
401
264
0.56
0.54
—
Second
Quarter
$ 2,431
385
2,816
386
419
316
0.67
0.65
0.50
Third
Quarter
$ 2,854
420
3,274
494
488
383
0.82
0.80
—
Fourth
Quarter
$ 3,557
554
4,111
513
507
356
0.77
0.75
0.57
Total
$ 10,893
1,733
12,626
1,753
1,815
1,319
2.81
2.74
1.07
Revenues:
Company sales
Franchise and license fees and income
Total revenues
Restaurant profit
Operating Profit(b)
Net Income – YUM! Brands, Inc.
Basic earnings per common share
Diluted earnings per common share
Dividends declared per common share
2010
First
Quarter
$ 1,996
349
2,345
340
364
241
0.51
0.50
0.21
Second
Quarter
$ 2,220
354
2,574
366
421
286
0.61
0.59
0.21
Third
Quarter
$ 2,496
366
2,862
479
544
357
0.76
0.74
—
Fourth
Quarter
$ 3,071
491
3,562
478
440
274
0.58
0.56
0.50
Total
$ 9,783
1,560
11,343
1,663
1,769
1,158
2.44
2.38
0.92
(a) Includes net losses of $65 million primarily related to the LJS and A&W divestitures, $88 million primarily related to
refranchising international markets and $28 million primarily related to the U.S. business transformation measures and
U.S. refranchising in the first, third and fourth quarters of 2011, respectively. See Note 4. The fourth quarter of 2011
also includes the $25 million impact of the 53rd week. See Note 2.
(b) Includes net losses of $66 million and $19 million in the first and fourth quarters of 2010, respectively, related primarily
to the U.S. business transformation measures and refranchising international markets. See Note 4.
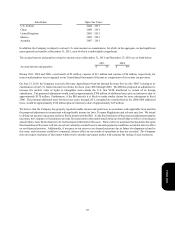
Note 21 – Subsequent Event
On February 1, 2012, subsequent to the end of the fourth quarter, we paid $584 million to acquire an additional 66% interest in
Little Sheep, which brought our total ownership to approximately 93% of the business. Upon acquisition, we have voting control
of Little Sheep and thus will begin to consolidate its results.
Form 10-K