Pizza Hut 2011 Annual Report Download - page 67
Download and view the complete annual report
Please find page 67 of the 2011 Pizza Hut annual report below. You can navigate through the pages in the report by either clicking on the pages listed below, or by using the keyword search tool below to find specific information within the annual report.-
 1
1 -
2
-
3
-
4
-
5
-
6
-
7
-
8
-
9
-
10
-
11
-
12
-
13
-
14
-
15
-
16
-
17
-
18
-
19
-
20
-
21
-
22
-
23
-
24
-
25
-
26
-
27
-
28
-
29
-
30
-
31
-
32
-
33
-
34
-
35
-
36
-
37
-
38
-
39
-
40
-
41
-
42
-
43
-
44
-
45
-
46
-
47
-
48
-
49
-
50
-
51
-
52
-
53
-
54
-
55
-
56
-
 57
57 -
 58
58 -
 59
59 -
 60
60 -
 61
61 -
 62
62 -
 63
63 -
 64
64 -
 65
65 -
 66
66 -
 67
67 -
 68
68 -
 69
69 -
 70
70 -
 71
71 -
 72
72 -
 73
73 -
 74
74 -
 75
75 -
 76
76 -
 77
77 -
78
-
79
-
80
-
81
-
82
-
83
-
84
-
85
-
86
-
87
-
88
-
89
-
90
-
91
-
92
-
93
-
94
-
95
-
96
-
97
-
98
-
99
-
100
-
101
-
102
-
103
-
104
-
105
-
106
-
107
-
108
-
109
-
110
-
111
-
112
-
113
-
114
-
115
-
116
-
117
-
118
-
119
-
120
-
121
-
122
-
123
-
124
-
125
-
126
-
127
-
128
-
129
-
130
-
131
-
132
-
133
-
134
-
135
-
136
-
137
-
138
-
139
-
140
-
141
-
142
-
143
-
144
-
145
-
146
-
147
-
148
-
149
-
150
-
151
-
152
-
153
-
154
-
155
-
156
-
157
-
158
-
159
-
160
-
161
-
162
-
163
-
164
-
165
-
166
-
167
-
168
-
169
-
170
-
171
-
172
-
173
-
174
-
175
-
176
-
177
-
178
-
179
-
180
-
181
-
182
-
183
-
184
-
185
-
186
-
187
-
188
-
189
-
190
-
191
-
192
-
193
-
194
-
195
-
196
-
197
-
198
-
199
-
200
-
201
-
202
-
203
-
204
-
205
-
206
-
207
-
208
-
209
-
210
-
211
-
212
 |
 |

16MAR201218542623
In setting compensation opportunities for 2011, the Committee considered the historical performance
of the Company for the one, three and five-year periods, noting that Mr. Novak has been Chairman and
CEO for that entire period. The data revealed that the Company had on average performed very strongly
compared to the nondurable consumer products peer group in terms of total shareholder return (top
quartile for the three and five-year periods), return on net assets (top quartile for each period), EPS
growth (top 50% for the one-year period and top quartile for the three and five-year periods) and
operating income growth (top 50% for the one-year period and top quartile for three and five-year
periods). Based on this continued sustained strong performance, the Committee determined that
Mr. Novak’s target total compensation for 2011 should be at or slightly below the 75th percentile as
compared to the compensation of chief executives in the peer group.
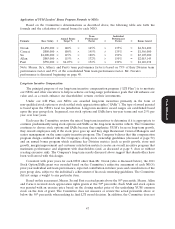
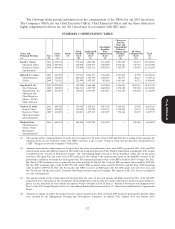
Based on this analysis, the Committee approved the following compensation for 2011:
Salary 1,450,000
Target Bonus Percentage 160
Grant Date Estimated Fair Value of 2011 LTI Awards: 7,190,000
The Committee increased Mr. Novak’s base salary by $50,000 (or 3.6%) to $1,450,000. The
Committee did not change his target bonus percentage noting that his total target cash after the salary
increase was slightly below the 75th percentile for target total cash. The Committee continues to believe
this compensation structure is in line with YUM’s pay-for-performance philosophy.
In January 2011, the Committee approved the grant of a long-term incentive award to Mr. Novak
having a grant date fair value of $7,190,000. This award was comprised of SARs with an estimated fair
value of $6,417,000, and PSUs under the Performance Share Plan with an estimated fair value of $773,000.
This award reflected the Committee’s subjective determination that, based on his strong performance in
2010 and the sustained performance of the Company (without assigning any weight to any particular item),
he should receive a long-term incentive award consistent with their desire to compensate Mr. Novak near
or at the 75th percentile for total compensation.
At the conclusion of 2011, the Committee determined Mr. Novak earned an annual bonus for 2011
Proxy Statement
performance of $4,541,400 based on his Team Performance Factor and his Individual Performance Factor.
The Committee had previously established, in January 2011, Mr. Novak’s Team Performance Factor
measures and targets for 2011 as set forth on page 46. The Committee determined that the Company’s
actual performance against these criteria and goals produced a Team Performance Factor of 145. Refer to
page 45 for information on how this Team Performance Factor was determined.
For purposes of determining Mr. Novak’s Individual Performance Factor, in addition to the criteria
highlighted on page 46, the Committee considered Mr. Novak’s leadership in enabling the Company to
achieve 14% EPS growth, marking the tenth consecutive year the Company has exceeded its EPS growth
target of 10%. The Committee also considered the performance of the Company’s divisions. The
Committee considered the very strong performance of the China Division in exceeding profit, system sales
and development targets as well as very good performance of YRI, especially in development and sales in
emerging markets and Mr. Novak’s continued commitment to developing strong leaders in the Company;
however, the Committee noted that U.S. business did not perform to expectation.
Based on this individual performance, the Committee awarded Mr. Novak an Individual Performance
Factor of 135.
After determination of the Team Performance Factor and Individual Performance Factor, Mr. Novak’s
annual bonus was calculated as shown on page 44.
While the Committee did not specifically discuss why Mr. Novak’s compensation exceeds that of other
NEOs, it does review every year, as part of its process for setting compensation described beginning on
49