Pizza Hut 2011 Annual Report Download - page 68
Download and view the complete annual report
Please find page 68 of the 2011 Pizza Hut annual report below. You can navigate through the pages in the report by either clicking on the pages listed below, or by using the keyword search tool below to find specific information within the annual report.-
 1
1 -
2
-
3
-
4
-
5
-
6
-
7
-
8
-
9
-
10
-
11
-
12
-
13
-
14
-
15
-
16
-
17
-
18
-
19
-
20
-
21
-
22
-
23
-
24
-
25
-
26
-
27
-
28
-
29
-
30
-
31
-
32
-
33
-
34
-
35
-
36
-
37
-
38
-
39
-
40
-
41
-
42
-
43
-
44
-
45
-
46
-
47
-
48
-
49
-
50
-
51
-
52
-
53
-
54
-
55
-
56
-
57
-
 58
58 -
 59
59 -
 60
60 -
 61
61 -
 62
62 -
 63
63 -
 64
64 -
 65
65 -
 66
66 -
 67
67 -
 68
68 -
 69
69 -
 70
70 -
 71
71 -
 72
72 -
 73
73 -
 74
74 -
 75
75 -
 76
76 -
 77
77 -
 78
78 -
79
-
80
-
81
-
82
-
83
-
84
-
85
-
86
-
87
-
88
-
89
-
90
-
91
-
92
-
93
-
94
-
95
-
96
-
97
-
98
-
99
-
100
-
101
-
102
-
103
-
104
-
105
-
106
-
107
-
108
-
109
-
110
-
111
-
112
-
113
-
114
-
115
-
116
-
117
-
118
-
119
-
120
-
121
-
122
-
123
-
124
-
125
-
126
-
127
-
128
-
129
-
130
-
131
-
132
-
133
-
134
-
135
-
136
-
137
-
138
-
139
-
140
-
141
-
142
-
143
-
144
-
145
-
146
-
147
-
148
-
149
-
150
-
151
-
152
-
153
-
154
-
155
-
156
-
157
-
158
-
159
-
160
-
161
-
162
-
163
-
164
-
165
-
166
-
167
-
168
-
169
-
170
-
171
-
172
-
173
-
174
-
175
-
176
-
177
-
178
-
179
-
180
-
181
-
182
-
183
-
184
-
185
-
186
-
187
-
188
-
189
-
190
-
191
-
192
-
193
-
194
-
195
-
196
-
197
-
198
-
199
-
200
-
201
-
202
-
203
-
204
-
205
-
206
-
207
-
208
-
209
-
210
-
211
-
212
 |
 |

16MAR201218540977
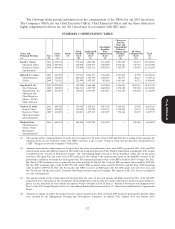
page 43, data from Meridian which substantiates on a comparative basis this difference in target
compensation for the CEO role relative to other executive roles. This comparative market data analyzed
over several years supports the differences in salary, annual bonus and long-term incentives.
Other Benefits
Retirement Benefits
We offer competitive retirement benefits through the YUM! Brands Retirement Plan. This is a broad-
based qualified plan designed to provide a retirement benefit based on years of service with the Company
and average annual earnings. In addition, the YUM! Brands, Inc. Pension Equalization Plan for employees
at all levels who meet the eligibility requirements is a ‘‘restoration plan’’ intended to restore benefits
otherwise lost under the qualified plan due to various governmental limits. This plan is based on the same
underlying formula as the YUM! Brands Retirement Plan. The annual benefit payable under these plans
to U.S.-based employees hired prior to October 1, 2001 is discussed following the Pension Benefits Table
on page 64. This benefit is designed to provide income replacement of approximately 40% of salary and
annual bonus (less the company’s contribution to social security on behalf of the employee) for employees
with 20 years of service who retire after age 62.
The annual change in pension value for each NEO is set forth on page 57, in the Summary
Compensation Table, and the actual projected benefit at termination is set forth on page 64, in the Pension
Benefits Table.
For executives hired or re-hired after September 30, 2001, the Company designed the Leadership
Retirement Plan (‘‘LRP’’). This is an unfunded, unsecured account-based retirement plan which allocates
a percentage of pay to a phantom account payable to the executive following the later to occur of the
executive’s retirement from the Company or attainment of age 55. For 2011, Mr. Pant was the only NEO
eligible for the LRP since he was hired after September 30, 2001. Under the LRP, he receives an annual
allocation to his account equal to 20% of his base salary and target bonus. For 2011, he received an
allocation of $300,000, which is set forth under the ‘‘All Other Compensation’’ column in the Summary
Compensation Table at page 57.
Proxy Statement
Medical, Dental, Life Insurance and Disability Coverage
We also provide other benefits such as medical, dental, life insurance and disability coverage to each
NEO through benefits plans, which are also provided to all eligible U.S.-based salaried employees. Eligible
employees, including the NEOs, can purchase additional life, dependent life and accidental death and
dismemberment coverage as part of their employee benefits package. Except for the imputed value of life
insurance premiums, the value of these benefits is not included in the Summary Compensation Table since
they are made available on a Company-wide basis to all U.S.-based salaried employees. In 2010, our
broad-based employee disability plan was changed to limit the annual benefit coverage to $300,000. For
employees whose coverage was reduced as a result of the change, the Company is purchasing individual
disability coverage for three years (provided employment continues) to restore the lost coverage resulting
from the cap placed on the broad-based employee plan. This coverage is provided to each NEO and the
incremental cost of the additional coverage is included in the ‘‘All Other Compensation’’ table at
footnote 3 at page 59.
Perquisites
Beginning in 2011, the Committee eliminated the following perquisites for all executive officers
(including the NEOs): car allowance, country club membership, perquisite allowance and annual physical.
In recognition of this change, NEOs (other than our CEO, who did not receive these perquisites, and
Mr. Su, whose perquisites are described below) received a one-time $25,000 increase to their salary
effective January 1, 2011.
50