Pizza Hut 2011 Annual Report Download - page 141
Download and view the complete annual report
Please find page 141 of the 2011 Pizza Hut annual report below. You can navigate through the pages in the report by either clicking on the pages listed below, or by using the keyword search tool below to find specific information within the annual report.-
 1
1 -
2
-
3
-
4
-
5
-
6
-
7
-
8
-
9
-
10
-
11
-
12
-
13
-
14
-
15
-
16
-
17
-
18
-
19
-
20
-
21
-
22
-
23
-
24
-
25
-
26
-
27
-
28
-
29
-
30
-
31
-
32
-
33
-
34
-
35
-
36
-
37
-
38
-
39
-
40
-
41
-
42
-
43
-
44
-
45
-
46
-
47
-
48
-
49
-
50
-
51
-
52
-
53
-
54
-
55
-
56
-
57
-
58
-
59
-
60
-
61
-
62
-
63
-
64
-
65
-
66
-
67
-
68
-
69
-
70
-
71
-
72
-
73
-
74
-
75
-
76
-
77
-
78
-
79
-
80
-
81
-
82
-
83
-
84
-
85
-
86
-
87
-
88
-
89
-
90
-
91
-
92
-
93
-
94
-
95
-
96
-
97
-
98
-
99
-
100
-
101
-
102
-
103
-
104
-
105
-
106
-
107
-
108
-
109
-
110
-
111
-
112
-
113
-
114
-
115
-
116
-
117
-
118
-
119
-
120
-
121
-
122
-
123
-
124
-
125
-
126
-
127
-
128
-
129
-
130
-
 131
131 -
 132
132 -
 133
133 -
 134
134 -
 135
135 -
 136
136 -
 137
137 -
 138
138 -
 139
139 -
 140
140 -
 141
141 -
 142
142 -
 143
143 -
 144
144 -
 145
145 -
 146
146 -
 147
147 -
 148
148 -
 149
149 -
 150
150 -
 151
151 -
152
-
153
-
154
-
155
-
156
-
157
-
158
-
159
-
160
-
161
-
162
-
163
-
164
-
165
-
166
-
167
-
168
-
169
-
170
-
171
-
172
-
173
-
174
-
175
-
176
-
177
-
178
-
179
-
180
-
181
-
182
-
183
-
184
-
185
-
186
-
187
-
188
-
189
-
190
-
191
-
192
-
193
-
194
-
195
-
196
-
197
-
198
-
199
-
200
-
201
-
202
-
203
-
204
-
205
-
206
-
207
-
208
-
209
-
210
-
211
-
212
 |
 |

37
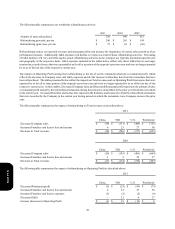
Operating Profit
China
YRI
United States
Unallocated Franchise and license fees and income
Unallocated Occupancy and Other
Unallocated and corporate expenses
Unallocated Closures and impairment expense
Unallocated Other income (expense)
Unallocated Refranchising gain (loss)
Operating Profit
China Operating margin
YRI Operating margin
United States Operating margin
Amount
2011
$ 908
673
589
—
14
(223)
(80)
6
(72)
$1,815
16.3%
20.6%
15.5%
2010
$ 755
589
668
—
9
(194)
—
5
(63)
$ 1,769
18.3%
19.1%
16.2%
2009
$ 596
497
647
(32)
—
(189)
(26)
71
26
$ 1,590
17.5%
16.6%
14.5%
% B/(W)
2011
20
14
(12)
NM
58
(15)
NM
NM
NM
3
(2.0)
1.5
(0.7)
ppts.
ppts.
ppts.
2010
27
19
3
NM
NM
(3)
NM
NM
NM
11
0.8
2.5
1.7
ppts.
ppts.
ppts.
% B/(W)
excluding
foreign
currency
translation
2011
15
9
N/A
N/A
N/A
N/A
N/A
N/A
N/A
(2)
(2.0)
1.4
N/A
2010
26
11
N/A
N/A
N/A
N/A
N/A
N/A
N/A
9
0.8
2.0
N/A
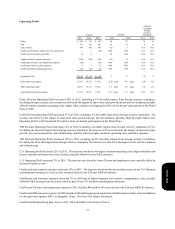
China Division Operating Profit increased 20% in 2011, including a 5% favorable impact from foreign currency translation.
Excluding foreign currency, the increase was driven by the impact of same-store sales growth and net unit development, partially
offset by higher restaurant operating costs, higher G&A expenses and lapping the effect of our brands' participation in the World
Expo in 2010.
China Division Operating Profit increased 27% in 2010, including a 1% favorable impact from foreign currency translation. The
increase was driven by the impact of same-store sales growth and new unit development, partially offset by higher G&A costs.
Operating Profit in 2010 benefited $16 million from our brands' participation in the World Expo.
YRI Division Operating Profit increased 14% in 2011, including a favorable impact from foreign currency translation of 5%.
Excluding the favorable impact from foreign currency translation, the increase of 9% was driven by the impact of same-store sales
growth, new unit development and refranchising, partially offset by higher restaurant operating costs and G&A expenses.
YRI Division Operating Profit increased 19% in 2010, including an 8% favorable impact from foreign currency translation.
Excluding the favorable impact from foreign currency translation, the increase was driven by the impact of new unit development
and refranchising.
U.S. Operating Profit decreased 12% in 2011. The decrease was driven by higher restaurant operating costs, higher franchise and
license expenses and same-store sales declines, partially offset by lower G&A expenses.
U.S. Operating Profit increased 3% in 2010. The increase was driven by lower Closure and impairment costs, partially offset by
increased litigation costs.
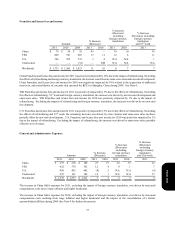
Unallocated and corporate expenses increased 15% in 2011. The increase was driven by actions taken as part of our U.S. Business
transformation measures, as well as costs incurred related to the LJS and A&W divestitures.
Unallocated and corporate expenses increased 3% in 2010 due to higher litigation and incentive compensation costs, partially
offset by G&A savings from the actions taken as part of our U.S. business transformation measures.
Unallocated Closures and impairment expense in 2011 includes $80 million of losses related to the LJS and A&W divestitures.
Unallocated Other income (expense) in 2009 includes a $68 million gain upon acquisition of additional ownership, and consolidation
of, the entity that operates KFCs in Shanghai, China. See Note 4 for further discussion.
Unallocated Refranchising gain (loss) in 2011, 2010 and 2009 is discussed in Note 4.
Form 10-K