Pizza Hut 2011 Annual Report Download - page 156
Download and view the complete annual report
Please find page 156 of the 2011 Pizza Hut annual report below. You can navigate through the pages in the report by either clicking on the pages listed below, or by using the keyword search tool below to find specific information within the annual report.-
 1
1 -
2
-
3
-
4
-
5
-
6
-
7
-
8
-
9
-
10
-
11
-
12
-
13
-
14
-
15
-
16
-
17
-
18
-
19
-
20
-
21
-
22
-
23
-
24
-
25
-
26
-
27
-
28
-
29
-
30
-
31
-
32
-
33
-
34
-
35
-
36
-
37
-
38
-
39
-
40
-
41
-
42
-
43
-
44
-
45
-
46
-
47
-
48
-
49
-
50
-
51
-
52
-
53
-
54
-
55
-
56
-
57
-
58
-
59
-
60
-
61
-
62
-
63
-
64
-
65
-
66
-
67
-
68
-
69
-
70
-
71
-
72
-
73
-
74
-
75
-
76
-
77
-
78
-
79
-
80
-
81
-
82
-
83
-
84
-
85
-
86
-
87
-
88
-
89
-
90
-
91
-
92
-
93
-
94
-
95
-
96
-
97
-
98
-
99
-
100
-
101
-
102
-
103
-
104
-
105
-
106
-
107
-
108
-
109
-
110
-
111
-
112
-
113
-
114
-
115
-
116
-
117
-
118
-
119
-
120
-
121
-
122
-
123
-
124
-
125
-
126
-
127
-
128
-
129
-
130
-
131
-
132
-
133
-
134
-
135
-
136
-
137
-
138
-
139
-
140
-
141
-
142
-
143
-
144
-
145
-
 146
146 -
 147
147 -
 148
148 -
 149
149 -
 150
150 -
 151
151 -
 152
152 -
 153
153 -
 154
154 -
 155
155 -
 156
156 -
 157
157 -
 158
158 -
 159
159 -
 160
160 -
 161
161 -
 162
162 -
 163
163 -
 164
164 -
 165
165 -
 166
166 -
167
-
168
-
169
-
170
-
171
-
172
-
173
-
174
-
175
-
176
-
177
-
178
-
179
-
180
-
181
-
182
-
183
-
184
-
185
-
186
-
187
-
188
-
189
-
190
-
191
-
192
-
193
-
194
-
195
-
196
-
197
-
198
-
199
-
200
-
201
-
202
-
203
-
204
-
205
-
206
-
207
-
208
-
209
-
210
-
211
-
212
 |
 |

52
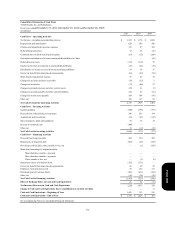
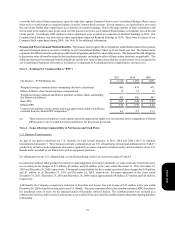
Consolidated Balance Sheets
YUM! Brands, Inc. and Subsidiaries
December 31, 2011 and December 25, 2010
(in millions)
ASSETS
Current Assets
Cash and cash equivalents
Accounts and notes receivable, net
Inventories
Prepaid expenses and other current assets
Deferred income taxes
Advertising cooperative assets, restricted
Total Current Assets
Property, plant and equipment, net
Goodwill
Intangible assets, net
Investments in unconsolidated affiliates
Restricted cash
Other assets
Deferred income taxes
Total Assets
LIABILITIES AND SHAREHOLDERS’ EQUITY
Current Liabilities
Accounts payable and other current liabilities
Income taxes payable
Short-term borrowings
Advertising cooperative liabilities
Total Current Liabilities
Long-term debt
Other liabilities and deferred credits
Total Liabilities
Shareholders’ Equity
Common Stock, no par value, 750 shares authorized; 460 shares and 469 shares issued in
2011 and 2010, respectively
Retained earnings
Accumulated other comprehensive loss
Total Shareholders’ Equity – YUM! Brands, Inc.
Noncontrolling interests
Total Shareholders’ Equity
Total Liabilities and Shareholders’ Equity
See accompanying Notes to Consolidated Financial Statements.
2011
$ 1,198
286
273
338
112
114
2,321
4,042
681
299
167
300
475
549
$ 8,834
$ 1,874
142
320
114
2,450
2,997
1,471
6,918
18
2,052
(247)
1,823
93
1,916
$ 8,834
2010
$ 1,426
256
189
269
61
112
2,313
3,830
659
475
154
—
519
366
$ 8,316
$ 1,602
61
673
112
2,448
2,915
1,284
6,647
86
1,717
(227)
1,576
93
1,669
$ 8,316
Form 10-K