Pizza Hut 2011 Annual Report Download - page 154
Download and view the complete annual report
Please find page 154 of the 2011 Pizza Hut annual report below. You can navigate through the pages in the report by either clicking on the pages listed below, or by using the keyword search tool below to find specific information within the annual report.-
 1
1 -
2
-
3
-
4
-
5
-
6
-
7
-
8
-
9
-
10
-
11
-
12
-
13
-
14
-
15
-
16
-
17
-
18
-
19
-
20
-
21
-
22
-
23
-
24
-
25
-
26
-
27
-
28
-
29
-
30
-
31
-
32
-
33
-
34
-
35
-
36
-
37
-
38
-
39
-
40
-
41
-
42
-
43
-
44
-
45
-
46
-
47
-
48
-
49
-
50
-
51
-
52
-
53
-
54
-
55
-
56
-
57
-
58
-
59
-
60
-
61
-
62
-
63
-
64
-
65
-
66
-
67
-
68
-
69
-
70
-
71
-
72
-
73
-
74
-
75
-
76
-
77
-
78
-
79
-
80
-
81
-
82
-
83
-
84
-
85
-
86
-
87
-
88
-
89
-
90
-
91
-
92
-
93
-
94
-
95
-
96
-
97
-
98
-
99
-
100
-
101
-
102
-
103
-
104
-
105
-
106
-
107
-
108
-
109
-
110
-
111
-
112
-
113
-
114
-
115
-
116
-
117
-
118
-
119
-
120
-
121
-
122
-
123
-
124
-
125
-
126
-
127
-
128
-
129
-
130
-
131
-
132
-
133
-
134
-
135
-
136
-
137
-
138
-
139
-
140
-
141
-
142
-
143
-
 144
144 -
 145
145 -
 146
146 -
 147
147 -
 148
148 -
 149
149 -
 150
150 -
 151
151 -
 152
152 -
 153
153 -
 154
154 -
 155
155 -
 156
156 -
 157
157 -
 158
158 -
 159
159 -
 160
160 -
 161
161 -
 162
162 -
 163
163 -
 164
164 -
165
-
166
-
167
-
168
-
169
-
170
-
171
-
172
-
173
-
174
-
175
-
176
-
177
-
178
-
179
-
180
-
181
-
182
-
183
-
184
-
185
-
186
-
187
-
188
-
189
-
190
-
191
-
192
-
193
-
194
-
195
-
196
-
197
-
198
-
199
-
200
-
201
-
202
-
203
-
204
-
205
-
206
-
207
-
208
-
209
-
210
-
211
-
212
 |
 |

50
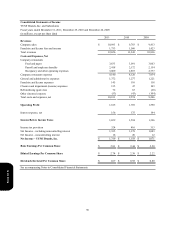
Consolidated Statements of Income
YUM! Brands, Inc. and Subsidiaries
Fiscal years ended December 31, 2011, December 25, 2010 and December 26, 2009
(in millions, except per share data)
Revenues
Company sales
Franchise and license fees and income
Total revenues
Costs and Expenses, Net
Company restaurants
Food and paper
Payroll and employee benefits
Occupancy and other operating expenses
Company restaurant expenses
General and administrative expenses
Franchise and license expenses
Closures and impairment (income) expenses
Refranchising (gain) loss
Other (income) expense
Total costs and expenses, net
Operating Profit
Interest expense, net
Income Before Income Taxes
Income tax provision
Net Income – including noncontrolling interest
Net Income – noncontrolling interest
Net Income – YUM! Brands, Inc.
Basic Earnings Per Common Share
Diluted Earnings Per Common Share
Dividends Declared Per Common Share
See accompanying Notes to Consolidated Financial Statements.
2011
$ 10,893
1,733
12,626
3,633
2,418
3,089
9,140
1,372
145
135
72
(53)
10,811
1,815
156
1,659
324
1,335
16
$ 1,319
$ 2.81
$ 2.74
$ 1.07
2010
$ 9,783
1,560
11,343
3,091
2,172
2,857
8,120
1,277
110
47
63
(43)
9,574
1,769
175
1,594
416
1,178
20
$ 1,158
$ 2.44
$ 2.38
$ 0.92
2009
$ 9,413
1,423
10,836
3,003
2,154
2,777
7,934
1,221
118
103
(26)
(104)
9,246
1,590
194
1,396
313
1,083
12
$ 1,071
$ 2.28
$ 2.22
$ 0.80
Form 10-K