Pizza Hut 2011 Annual Report Download - page 137
Download and view the complete annual report
Please find page 137 of the 2011 Pizza Hut annual report below. You can navigate through the pages in the report by either clicking on the pages listed below, or by using the keyword search tool below to find specific information within the annual report.-
 1
1 -
2
-
3
-
4
-
5
-
6
-
7
-
8
-
9
-
10
-
11
-
12
-
13
-
14
-
15
-
16
-
17
-
18
-
19
-
20
-
21
-
22
-
23
-
24
-
25
-
26
-
27
-
28
-
29
-
30
-
31
-
32
-
33
-
34
-
35
-
36
-
37
-
38
-
39
-
40
-
41
-
42
-
43
-
44
-
45
-
46
-
47
-
48
-
49
-
50
-
51
-
52
-
53
-
54
-
55
-
56
-
57
-
58
-
59
-
60
-
61
-
62
-
63
-
64
-
65
-
66
-
67
-
68
-
69
-
70
-
71
-
72
-
73
-
74
-
75
-
76
-
77
-
78
-
79
-
80
-
81
-
82
-
83
-
84
-
85
-
86
-
87
-
88
-
89
-
90
-
91
-
92
-
93
-
94
-
95
-
96
-
97
-
98
-
99
-
100
-
101
-
102
-
103
-
104
-
105
-
106
-
107
-
108
-
109
-
110
-
111
-
112
-
113
-
114
-
115
-
116
-
117
-
118
-
119
-
120
-
121
-
122
-
123
-
124
-
125
-
126
-
 127
127 -
 128
128 -
 129
129 -
 130
130 -
 131
131 -
 132
132 -
 133
133 -
 134
134 -
 135
135 -
 136
136 -
 137
137 -
 138
138 -
 139
139 -
 140
140 -
 141
141 -
 142
142 -
 143
143 -
 144
144 -
 145
145 -
 146
146 -
 147
147 -
148
-
149
-
150
-
151
-
152
-
153
-
154
-
155
-
156
-
157
-
158
-
159
-
160
-
161
-
162
-
163
-
164
-
165
-
166
-
167
-
168
-
169
-
170
-
171
-
172
-
173
-
174
-
175
-
176
-
177
-
178
-
179
-
180
-
181
-
182
-
183
-
184
-
185
-
186
-
187
-
188
-
189
-
190
-
191
-
192
-
193
-
194
-
195
-
196
-
197
-
198
-
199
-
200
-
201
-
202
-
203
-
204
-
205
-
206
-
207
-
208
-
209
-
210
-
211
-
212
 |
 |

33
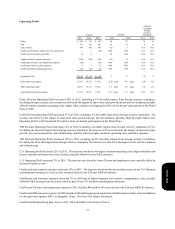
Income / (Expense)
Company sales
Cost of sales
Cost of labor
Occupancy and other
Restaurant profit
Restaurant margin
2010 vs. 2009
2009
$ 3,352
(1,175)
(447)
(1,025)
$ 705
21.0%
Store
Portfolio
Actions
$ 484
(162)
(78)
(160)
$ 84
Other
$ 207
(12)
(56)
(35)
$ 104
FX
$ 38
(13)
(6)
(11)
$ 8
2010
$ 4,081
(1,362)
(587)
(1,231)
$ 901
22.1%
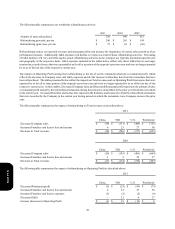
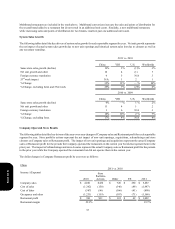
In 2011, the increase in China Company sales and Restaurant profit associated with store portfolio actions was primarily driven
by the development of new units partially offset by lapping the benefit of our participation in the World Expo in 2010. Significant
other factors impacting Company sales and/or Restaurant profit were Company same-store sales growth of 18% which was driven
by transaction growth partially offset by a negative impact from sales mix shift and a new business tax that took effect December
2010, wage rate inflation of 20% as well as commodity inflation of $90 million, or 8%.
In 2010, the increase in China Company sales and Restaurant profit associated with store portfolio actions was primarily driven
by the development of new units and the acquisition of additional interest in and consolidation of a former China unconsolidated
affiliate during 2009 (See Note 4 for further discussion) and $16 million in Restaurant profit from our brands’ participation in the
World Expo during 2010. Significant other factors impacting Company sales and/or Restaurant profit were Company same-store
sales growth of 6% and commodity deflation of $26 million partially offset by labor inflation.
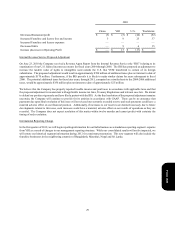
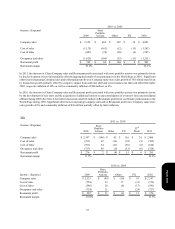
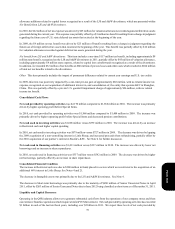
YRI
Income / (Expense)
Company sales
Cost of sales
Cost of labor
Occupancy and other
Restaurant profit
Restaurant margin
2011 vs. 2010
2010
$ 2,347
(753)
(591)
(727)
$ 276
11.7%
Store
Portfolio
Actions
$(148)
67
34
49
$ 2
Other
$ 62
(36)
(21)
(9)
$(4)
FX
$ 116
(38)
(30)
(33)
$ 15
53rd
Week
$ 29
(9)
(8)
(6)
$ 6
2011
$ 2,406
(769)
(616)
(726)
$ 295
12.3%
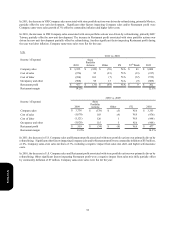
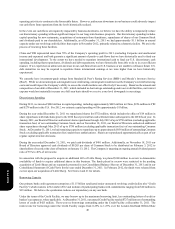
Income / (Expense)
Company sales
Cost of sales
Cost of labor
Occupancy and other
Restaurant profit
Restaurant margin
2010 vs. 2009
2009
$ 2,323
(758)
(586)
(724)
$ 255
10.9%
Store
Portfolio
Actions
$(49)
19
20
21
$ 11
Other
$(10)
17
(8)
—
$(1)
FX
$ 83
(31)
(17)
(24)
$ 11
2010
$ 2,347
(753)
(591)
(727)
$ 276
11.7%
Form 10-K