Pizza Hut 2011 Annual Report Download - page 177
Download and view the complete annual report
Please find page 177 of the 2011 Pizza Hut annual report below. You can navigate through the pages in the report by either clicking on the pages listed below, or by using the keyword search tool below to find specific information within the annual report.-
 1
1 -
2
-
3
-
4
-
5
-
6
-
7
-
8
-
9
-
10
-
11
-
12
-
13
-
14
-
15
-
16
-
17
-
18
-
19
-
20
-
21
-
22
-
23
-
24
-
25
-
26
-
27
-
28
-
29
-
30
-
31
-
32
-
33
-
34
-
35
-
36
-
37
-
38
-
39
-
40
-
41
-
42
-
43
-
44
-
45
-
46
-
47
-
48
-
49
-
50
-
51
-
52
-
53
-
54
-
55
-
56
-
57
-
58
-
59
-
60
-
61
-
62
-
63
-
64
-
65
-
66
-
67
-
68
-
69
-
70
-
71
-
72
-
73
-
74
-
75
-
76
-
77
-
78
-
79
-
80
-
81
-
82
-
83
-
84
-
85
-
86
-
87
-
88
-
89
-
90
-
91
-
92
-
93
-
94
-
95
-
96
-
97
-
98
-
99
-
100
-
101
-
102
-
103
-
104
-
105
-
106
-
107
-
108
-
109
-
110
-
111
-
112
-
113
-
114
-
115
-
116
-
117
-
118
-
119
-
120
-
121
-
122
-
123
-
124
-
125
-
126
-
127
-
128
-
129
-
130
-
131
-
132
-
133
-
134
-
135
-
136
-
137
-
138
-
139
-
140
-
141
-
142
-
143
-
144
-
145
-
146
-
147
-
148
-
149
-
150
-
151
-
152
-
153
-
154
-
155
-
156
-
157
-
158
-
159
-
160
-
161
-
162
-
163
-
164
-
165
-
166
-
 167
167 -
 168
168 -
 169
169 -
 170
170 -
 171
171 -
 172
172 -
 173
173 -
 174
174 -
 175
175 -
 176
176 -
 177
177 -
 178
178 -
 179
179 -
 180
180 -
 181
181 -
 182
182 -
 183
183 -
 184
184 -
 185
185 -
 186
186 -
 187
187 -
188
-
189
-
190
-
191
-
192
-
193
-
194
-
195
-
196
-
197
-
198
-
199
-
200
-
201
-
202
-
203
-
204
-
205
-
206
-
207
-
208
-
209
-
210
-
211
-
212
 |
 |

73
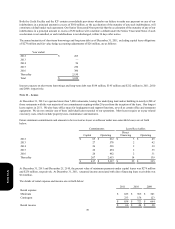
At December 31, 2011 the carrying values of cash and cash equivalents, accounts receivable and accounts payable approximated
their fair values because of the short-term nature of these instruments. The fair value of notes receivable net of allowances and
lease guarantees less subsequent amortization approximates their carrying value. The Company’s debt obligations, excluding
capital leases, were estimated to have a fair value of $3.5 billion, compared to their carrying value of $3.0 billion. We estimated
the fair value of debt using market quotes and calculations based on market rates.
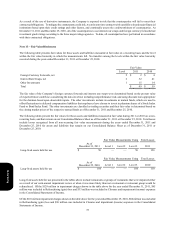
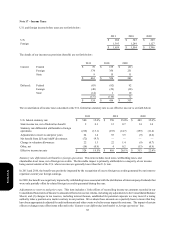
Note 14 – Pension, Retiree Medical and Retiree Savings Plans
Pension Benefits
We sponsor noncontributory defined benefit pension plans covering certain full-time salaried and hourly U.S. employees. The
most significant of these plans, the YUM Retirement Plan (the “Plan”), is funded while benefits from the other U.S. plans are paid
by the Company as incurred. During 2001, the plans covering our U.S. salaried employees were amended such that any salaried
employee hired or rehired by YUM after September 30, 2001 is not eligible to participate in those plans. Benefits are based on
years of service and earnings or stated amounts for each year of service. We also sponsor various defined benefit pension plans
covering certain of our non-U.S. employees, the most significant of which are in the UK. Our plans in the UK have previously
been amended such that new employees are not eligible to participate in these plans. Additionally, in 2011 one of our UK plans
was frozen such that existing participants can no longer earn future service credits. This resulted in a curtailment gain of $10
million which was credited to Accumulated other comprehensive income (loss).
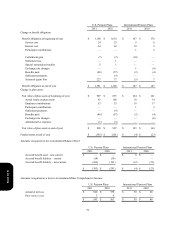
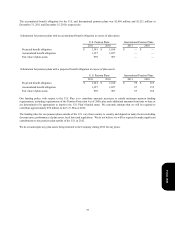
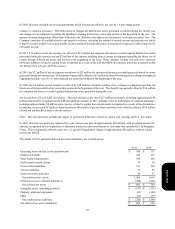
Obligation and Funded Status at Measurement Date:
The following chart summarizes the balance sheet impact, as well as benefit obligations, assets, and funded status associated with
our U.S. pension plans and significant International pension plans. The actuarial valuations for all plans reflect measurement dates
coinciding with our fiscal year ends.
Form 10-K