Pizza Hut 2011 Annual Report Download - page 182
Download and view the complete annual report
Please find page 182 of the 2011 Pizza Hut annual report below. You can navigate through the pages in the report by either clicking on the pages listed below, or by using the keyword search tool below to find specific information within the annual report.-
 1
1 -
2
-
3
-
4
-
5
-
6
-
7
-
8
-
9
-
10
-
11
-
12
-
13
-
14
-
15
-
16
-
17
-
18
-
19
-
20
-
21
-
22
-
23
-
24
-
25
-
26
-
27
-
28
-
29
-
30
-
31
-
32
-
33
-
34
-
35
-
36
-
37
-
38
-
39
-
40
-
41
-
42
-
43
-
44
-
45
-
46
-
47
-
48
-
49
-
50
-
51
-
52
-
53
-
54
-
55
-
56
-
57
-
58
-
59
-
60
-
61
-
62
-
63
-
64
-
65
-
66
-
67
-
68
-
69
-
70
-
71
-
72
-
73
-
74
-
75
-
76
-
77
-
78
-
79
-
80
-
81
-
82
-
83
-
84
-
85
-
86
-
87
-
88
-
89
-
90
-
91
-
92
-
93
-
94
-
95
-
96
-
97
-
98
-
99
-
100
-
101
-
102
-
103
-
104
-
105
-
106
-
107
-
108
-
109
-
110
-
111
-
112
-
113
-
114
-
115
-
116
-
117
-
118
-
119
-
120
-
121
-
122
-
123
-
124
-
125
-
126
-
127
-
128
-
129
-
130
-
131
-
132
-
133
-
134
-
135
-
136
-
137
-
138
-
139
-
140
-
141
-
142
-
143
-
144
-
145
-
146
-
147
-
148
-
149
-
150
-
151
-
152
-
153
-
154
-
155
-
156
-
157
-
158
-
159
-
160
-
161
-
162
-
163
-
164
-
165
-
166
-
167
-
168
-
169
-
170
-
171
-
 172
172 -
 173
173 -
 174
174 -
 175
175 -
 176
176 -
 177
177 -
 178
178 -
 179
179 -
 180
180 -
 181
181 -
 182
182 -
 183
183 -
 184
184 -
 185
185 -
 186
186 -
 187
187 -
 188
188 -
 189
189 -
 190
190 -
 191
191 -
 192
192 -
193
-
194
-
195
-
196
-
197
-
198
-
199
-
200
-
201
-
202
-
203
-
204
-
205
-
206
-
207
-
208
-
209
-
210
-
211
-
212
 |
 |

78
A mutual fund held as an investment by the Plan includes shares of YUM common stock valued at $0.7 million at December 31,
2011 and $0.6 million at December 25, 2010 (less than 1% of total plan assets in each instance).
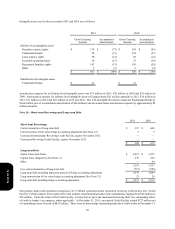
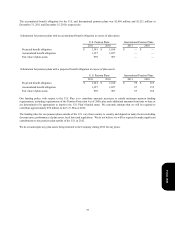
Benefit Payments
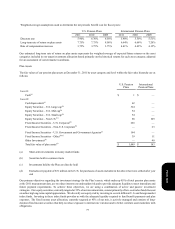
The benefits expected to be paid in each of the next five years and in the aggregate for the five years thereafter are set forth below:
Year ended:
2012
2013
2014
2015
2016
2017 - 2021
U.S.
Pension Plans
$ 68
50
47
50
51
309
International
Pension Plans
$ 1
1
1
1
1
8
Expected benefits are estimated based on the same assumptions used to measure our benefit obligation on the measurement date
and include benefits attributable to estimated future employee service.
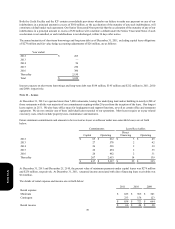
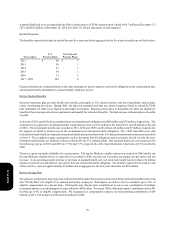
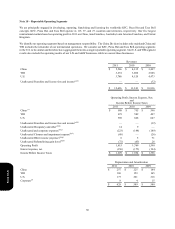
Retiree Medical Benefits
Our post-retirement plan provides health care benefits, principally to U.S. salaried retirees and their dependents, and includes
retiree cost-sharing provisions. During 2001, the plan was amended such that any salaried employee hired or rehired by YUM
after September 30, 2001 is not eligible to participate in this plan. Employees hired prior to September 30, 2001 are eligible for
benefits if they meet age and service requirements and qualify for retirement benefits. We fund our post-retirement plan as benefits
are paid.
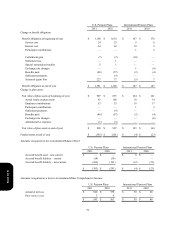
At the end of 2011 and 2010, the accumulated post-retirement benefit obligation was $86 million and $78 million, respectively. The
actuarial loss recognized in Accumulated other comprehensive loss was $12 million at the end of 2011 and $6 million at the end
of 2010. The net periodic benefit cost recorded in 2011, 2010 and 2009 was $6 million, $6 million and $7 million, respectively,
the majority of which is interest cost on the accumulated post-retirement benefit obligation. 2011, 2010 and 2009 costs each
included less than $1 million of special termination benefits primarily related to the U.S. business transformation measures described
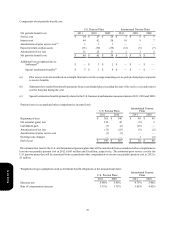
in Note 4. The weighted-average assumptions used to determine benefit obligations and net periodic benefit cost for the post-
retirement medical plan are identical to those as shown for the U.S. pension plans. Our assumed heath care cost trend rates for
the following year as of 2011 and 2010 are 7.5% and 7.7%, respectively, with expected ultimate trend rates of 4.5% reached in
2028.
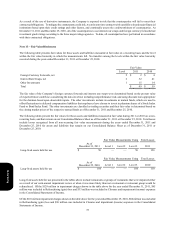
There is a cap on our medical liability for certain retirees. The cap for Medicare-eligible retirees was reached in 2000 and the cap
for non-Medicare eligible retirees is expected to be reached in 2014; once the cap is reached, our annual cost per retiree will not
increase. A one-percentage-point increase or decrease in assumed health care cost trend rates would have less than a $1 million
impact on total service and interest cost and on the post-retirement benefit obligation. The benefits expected to be paid in each
of the next five years are approximately $7 million and in aggregate for the five years thereafter are $29 million.
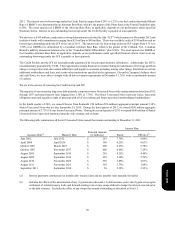
Retiree Savings Plan
We sponsor a contributory plan to provide retirement benefits under the provisions of Section 401(k) of the Internal Revenue Code
(the “401(k) Plan”) for eligible U.S. salaried and hourly employees. Participants are able to elect to contribute up to 75% of
eligible compensation on a pre-tax basis. Participants may allocate their contributions to one or any combination of multiple
investment options or a self-managed account within the 401(k) Plan. We match 100% of the participant’s contribution to the 401
(k) Plan up to 6% of eligible compensation. We recognized as compensation expense our total matching contribution of $14
million in 2011, $15 million in 2010 and $16 million in 2009.
Form 10-K