Pizza Hut 2011 Annual Report Download - page 157
Download and view the complete annual report
Please find page 157 of the 2011 Pizza Hut annual report below. You can navigate through the pages in the report by either clicking on the pages listed below, or by using the keyword search tool below to find specific information within the annual report.-
 1
1 -
2
-
3
-
4
-
5
-
6
-
7
-
8
-
9
-
10
-
11
-
12
-
13
-
14
-
15
-
16
-
17
-
18
-
19
-
20
-
21
-
22
-
23
-
24
-
25
-
26
-
27
-
28
-
29
-
30
-
31
-
32
-
33
-
34
-
35
-
36
-
37
-
38
-
39
-
40
-
41
-
42
-
43
-
44
-
45
-
46
-
47
-
48
-
49
-
50
-
51
-
52
-
53
-
54
-
55
-
56
-
57
-
58
-
59
-
60
-
61
-
62
-
63
-
64
-
65
-
66
-
67
-
68
-
69
-
70
-
71
-
72
-
73
-
74
-
75
-
76
-
77
-
78
-
79
-
80
-
81
-
82
-
83
-
84
-
85
-
86
-
87
-
88
-
89
-
90
-
91
-
92
-
93
-
94
-
95
-
96
-
97
-
98
-
99
-
100
-
101
-
102
-
103
-
104
-
105
-
106
-
107
-
108
-
109
-
110
-
111
-
112
-
113
-
114
-
115
-
116
-
117
-
118
-
119
-
120
-
121
-
122
-
123
-
124
-
125
-
126
-
127
-
128
-
129
-
130
-
131
-
132
-
133
-
134
-
135
-
136
-
137
-
138
-
139
-
140
-
141
-
142
-
143
-
144
-
145
-
146
-
 147
147 -
 148
148 -
 149
149 -
 150
150 -
 151
151 -
 152
152 -
 153
153 -
 154
154 -
 155
155 -
 156
156 -
 157
157 -
 158
158 -
 159
159 -
 160
160 -
 161
161 -
 162
162 -
 163
163 -
 164
164 -
 165
165 -
 166
166 -
 167
167 -
168
-
169
-
170
-
171
-
172
-
173
-
174
-
175
-
176
-
177
-
178
-
179
-
180
-
181
-
182
-
183
-
184
-
185
-
186
-
187
-
188
-
189
-
190
-
191
-
192
-
193
-
194
-
195
-
196
-
197
-
198
-
199
-
200
-
201
-
202
-
203
-
204
-
205
-
206
-
207
-
208
-
209
-
210
-
211
-
212
 |
 |

53
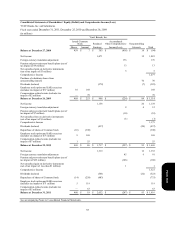
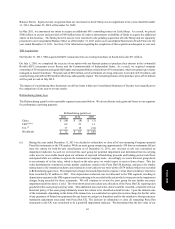
Consolidated Statements of Shareholders’ Equity (Deficit) and Comprehensive Income (Loss)
YUM! Brands, Inc. and Subsidiaries
Fiscal years ended December 31, 2011, December 25, 2010 and December 26, 2009
(in millions)
Balance at December 27, 2008
Net Income
Foreign currency translation adjustment
Pension and post-retirement benefit plans (net of
tax impact of $9 million)
Net unrealized gain on derivative instruments
(net of tax impact of $3 million)
Comprehensive Income
Purchase of subsidiary shares from
noncontrolling interest
Dividends declared
Employee stock option and SARs exercises
(includes tax impact of $57 million)
Compensation-related events (includes tax
impact of $2 million)
Balance at December 26, 2009
Net Income
Foreign currency translation adjustment
Pension and post-retirement benefit plans (net of
tax impact of $7 million)
Net unrealized loss on derivative instruments
(net of tax impact of $1 million)
Comprehensive Income
Dividends declared
Repurchase of shares of Common Stock
Employee stock option and SARs exercises
(includes tax impact of $73 million)
Compensation-related events (includes tax
impact of $7 million)
Balance at December 25, 2010
Net Income
Foreign currency translation adjustment
Pension and post-retirement benefit plans (net of
tax impact of $65 million)
Net unrealized gain on derivative instruments
(net of tax impact of less than $1 million)
Comprehensive Income
Dividends declared
Repurchase of shares of Common Stock
Employee stock option and SARs exercises
(includes tax impact of $71 million)
Compensation-related events (includes tax
impact of $5 million)
Balance at December 31, 2011
See accompanying Notes to Consolidated Financial Statements.
Yum! Brands, Inc.
Issued Common
Stock
Shares
459
10
—
469
(10)
9
1
469
(14)
5
—
460
Amount
$ 7
168
78
$ 253
(390)
168
55
$ 86
(250)
119
63
$ 18
Retained
Earnings
$ 303
1,071
(378)
$ 996
1,158
(437)
$ 1,717
1,319
(501)
(483)
$ 2,052
Accumulated
Other Comprehensive
Income(Loss)
$ (418)
176
13
5
$ (224)
8
(10)
(1)
$ (227)
85
(106)
1
$ (247)
Noncontrolling
Interests
$ 14
12
70
(7)
$ 89
20
4
(20)
$ 93
16
6
(22)
$ 93
Total
$ (94)
1,083
176
13
5
1,277
70
(385)
168
78
$ 1,114
1,178
12
(10)
(1)
1,179
(457)
(390)
168
55
$ 1,669
1,335
91
(106)
1
1,321
(523)
(733)
119
63
$ 1,916
Form 10-K