Pizza Hut 2011 Annual Report Download - page 170
Download and view the complete annual report
Please find page 170 of the 2011 Pizza Hut annual report below. You can navigate through the pages in the report by either clicking on the pages listed below, or by using the keyword search tool below to find specific information within the annual report.-
 1
1 -
2
-
3
-
4
-
5
-
6
-
7
-
8
-
9
-
10
-
11
-
12
-
13
-
14
-
15
-
16
-
17
-
18
-
19
-
20
-
21
-
22
-
23
-
24
-
25
-
26
-
27
-
28
-
29
-
30
-
31
-
32
-
33
-
34
-
35
-
36
-
37
-
38
-
39
-
40
-
41
-
42
-
43
-
44
-
45
-
46
-
47
-
48
-
49
-
50
-
51
-
52
-
53
-
54
-
55
-
56
-
57
-
58
-
59
-
60
-
61
-
62
-
63
-
64
-
65
-
66
-
67
-
68
-
69
-
70
-
71
-
72
-
73
-
74
-
75
-
76
-
77
-
78
-
79
-
80
-
81
-
82
-
83
-
84
-
85
-
86
-
87
-
88
-
89
-
90
-
91
-
92
-
93
-
94
-
95
-
96
-
97
-
98
-
99
-
100
-
101
-
102
-
103
-
104
-
105
-
106
-
107
-
108
-
109
-
110
-
111
-
112
-
113
-
114
-
115
-
116
-
117
-
118
-
119
-
120
-
121
-
122
-
123
-
124
-
125
-
126
-
127
-
128
-
129
-
130
-
131
-
132
-
133
-
134
-
135
-
136
-
137
-
138
-
139
-
140
-
141
-
142
-
143
-
144
-
145
-
146
-
147
-
148
-
149
-
150
-
151
-
152
-
153
-
154
-
155
-
156
-
157
-
158
-
159
-
 160
160 -
 161
161 -
 162
162 -
 163
163 -
 164
164 -
 165
165 -
 166
166 -
 167
167 -
 168
168 -
 169
169 -
 170
170 -
 171
171 -
 172
172 -
 173
173 -
 174
174 -
 175
175 -
 176
176 -
 177
177 -
 178
178 -
 179
179 -
 180
180 -
181
-
182
-
183
-
184
-
185
-
186
-
187
-
188
-
189
-
190
-
191
-
192
-
193
-
194
-
195
-
196
-
197
-
198
-
199
-
200
-
201
-
202
-
203
-
204
-
205
-
206
-
207
-
208
-
209
-
210
-
211
-
212
 |
 |

66
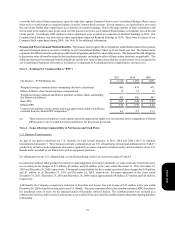
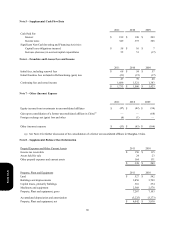
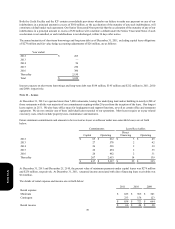
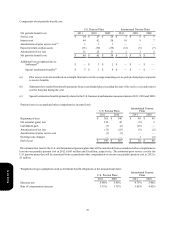
Note 5 – Supplemental Cash Flow Data
Cash Paid For:
Interest
Income taxes
Significant Non-Cash Investing and Financing Activities:
Capital lease obligations incurred
Increase (decrease) in accrued capital expenditures
2011
$ 199
349
$ 58
55
2010
$ 190
357
$ 16
51
2009
$ 209
308
$ 7
(17)
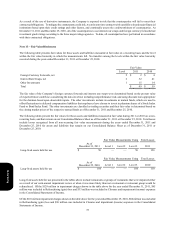
Note 6 – Franchise and License Fees and Income
Initial fees, including renewal fees
Initial franchise fees included in Refranchising (gain) loss
Continuing fees and rental income
2011
$ 68
(21)
47
1,686
$ 1,733
2010
$ 54
(15)
39
1,521
$ 1,560
2009
$ 57
(17)
40
1,383
$ 1,423
Note 7 – Other (Income) Expense
Equity income from investments in unconsolidated affiliates
Gain upon consolidation of a former unconsolidated affiliate in China(a)
Foreign exchange net (gain) loss and other
Other (income) expense
2011
$(47)
—
(6)
$(53)
2010
$(42)
—
(1)
$(43)
2009
$(36)
(68)
—
$(104)
(a) See Note 4 for further discussion of the consolidation of a former unconsolidated affiliate in Shanghai, China.
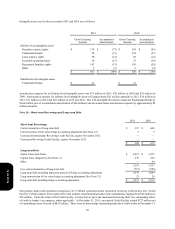
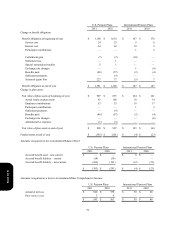
Note 8 – Supplemental Balance Sheet Information
Prepaid Expenses and Other Current Assets
Income tax receivable
Assets held for sale
Other prepaid expenses and current assets
2011
$ 150
24
164
$ 338
2010
$ 115
23
131
$ 269
Property, Plant and Equipment
Land
Buildings and improvements
Capital leases, primarily buildings
Machinery and equipment
Property, Plant and equipment, gross
Accumulated depreciation and amortization
Property, Plant and equipment, net
2011
$ 527
3,856
316
2,568
7,267
(3,225)
$ 4,042
2010
$ 542
3,709
274
2,578
7,103
(3,273)
$ 3,830
Form 10-K