Pizza Hut 2011 Annual Report Download - page 128
Download and view the complete annual report
Please find page 128 of the 2011 Pizza Hut annual report below. You can navigate through the pages in the report by either clicking on the pages listed below, or by using the keyword search tool below to find specific information within the annual report.-
 1
1 -
2
-
3
-
4
-
5
-
6
-
7
-
8
-
9
-
10
-
11
-
12
-
13
-
14
-
15
-
16
-
17
-
18
-
19
-
20
-
21
-
22
-
23
-
24
-
25
-
26
-
27
-
28
-
29
-
30
-
31
-
32
-
33
-
34
-
35
-
36
-
37
-
38
-
39
-
40
-
41
-
42
-
43
-
44
-
45
-
46
-
47
-
48
-
49
-
50
-
51
-
52
-
53
-
54
-
55
-
56
-
57
-
58
-
59
-
60
-
61
-
62
-
63
-
64
-
65
-
66
-
67
-
68
-
69
-
70
-
71
-
72
-
73
-
74
-
75
-
76
-
77
-
78
-
79
-
80
-
81
-
82
-
83
-
84
-
85
-
86
-
87
-
88
-
89
-
90
-
91
-
92
-
93
-
94
-
95
-
96
-
97
-
98
-
99
-
100
-
101
-
102
-
103
-
104
-
105
-
106
-
107
-
108
-
109
-
110
-
111
-
112
-
113
-
114
-
115
-
116
-
117
-
 118
118 -
 119
119 -
 120
120 -
 121
121 -
 122
122 -
 123
123 -
 124
124 -
 125
125 -
 126
126 -
 127
127 -
 128
128 -
 129
129 -
 130
130 -
 131
131 -
 132
132 -
 133
133 -
 134
134 -
 135
135 -
 136
136 -
 137
137 -
 138
138 -
139
-
140
-
141
-
142
-
143
-
144
-
145
-
146
-
147
-
148
-
149
-
150
-
151
-
152
-
153
-
154
-
155
-
156
-
157
-
158
-
159
-
160
-
161
-
162
-
163
-
164
-
165
-
166
-
167
-
168
-
169
-
170
-
171
-
172
-
173
-
174
-
175
-
176
-
177
-
178
-
179
-
180
-
181
-
182
-
183
-
184
-
185
-
186
-
187
-
188
-
189
-
190
-
191
-
192
-
193
-
194
-
195
-
196
-
197
-
198
-
199
-
200
-
201
-
202
-
203
-
204
-
205
-
206
-
207
-
208
-
209
-
210
-
211
-
212
 |
 |

24
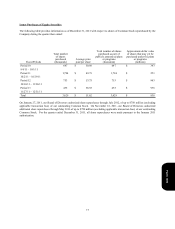
Detail of Special Items
U.S. Refranchising gain (loss)
Depreciation reduction from KFC U.S. restaurants impaired upon offer
to sell
Charges relating to U.S. G&A productivity initiatives and realignment of
resources
Investments in our U.S. Brands
LJS and A&W Goodwill impairment charge
Losses and other costs relating to the LJS and A&W divestitures
Losses associated with refranchising equity markets outside the U.S.
Depreciation reduction from Pizza UK restaurants impaired upon
decision to sell
Gain upon consolidation of a former unconsolidated affiliate in China
Special Items Income (Expense)
Tax Benefit (Expense) on Special Items(a)
Special Items Income (Expense), net of tax
Average diluted shares outstanding
Special Items diluted EPS
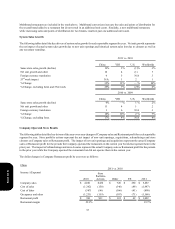
Reconciliation of Operating Profit Before Special Items to Reported
Operating Profit
Operating Profit before Special Items
Special Items Income (Expense)
Reported Operating Profit
Reconciliation of EPS Before Special Items to Reported EPS
Diluted EPS before Special Items
Special Items EPS
Reported EPS
Reconciliation of Effective Tax Rate Before Special Items to Reported
Effective Tax Rate
Effective Tax Rate before Special Items
Impact on Tax Rate as a result of Special Items(a)
Reported Effective Tax Rate
Year
12/31/2011
$ (17)
10
(21)
—
—
(86)
(76)
3
—
(187)
123
$ (64)
481
$ (0.13)
$ 2,002
(187)
$ 1,815
$ 2.87
(0.13)
$ 2.74
24.2 %
(4.7)%
19.5 %
12/25/2010
$(18)
9
(9)
—
—
—
(59)
—
—
(77)
7
$(70)
486
$(0.15)
$ 1,846
(77)
$ 1,769
$ 2.53
(0.15)
$ 2.38
25.3%
0.8%
26.1%
12/26/2009
$ 34
—
(16)
(32)
(26)
—
(10)
—
68
18
5
$ 23
483
$ 0.05
$ 1,572
18
$ 1,590
$ 2.17
0.05
$ 2.22
23.1 %
(0.7)%
22.4 %
(a) The tax benefit (expense) was determined based upon the impact of the nature, as well as the jurisdiction of the respective
individual components within Special Items.
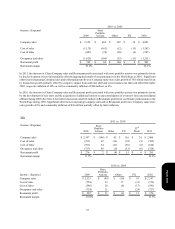
U.S. Business Transformation
The U.S. business transformation measures in 2011, 2010 and 2009 included: continuation of our U.S. refranchising; G&A
productivity initiatives and realignment of resources (primarily severance and early retirement costs); a reduced emphasis on
multi-branding as a long-term growth strategy; and investments in our U.S. Brands made on behalf of our franchisees such as
equipment purchases.
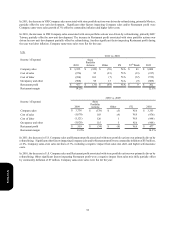
In the years ended December 31, 2011 and December 25, 2010, we recorded pre-tax losses of $17 million and $18 million from
refranchising in the U.S., respectively. In the year ended December 26, 2009, we recorded a pre-tax refranchising gain of $34
million in the U.S. The losses recorded in the years ended December 31, 2011 and December 25, 2010 are primarily the net result
of gains from restaurants sold and non-cash impairment charges related to our offers to refranchise restaurants in the U.S., principally
a substantial portion of our Company-operated KFC restaurants. The non-cash impairment charges that we recorded related to
our offers to refranchise these Company-operated KFC restaurants in the U.S. decreased depreciation expense versus what we
would have otherwise recorded by $10 million and $9 million in the years ended December 31, 2011 and December 25, 2010,
respectively. This depreciation reduction was recorded as a Special Item, resulting in depreciation expense in the U.S. segment
Form 10-K