Pizza Hut 2011 Annual Report Download - page 176
Download and view the complete annual report
Please find page 176 of the 2011 Pizza Hut annual report below. You can navigate through the pages in the report by either clicking on the pages listed below, or by using the keyword search tool below to find specific information within the annual report.-
 1
1 -
2
-
3
-
4
-
5
-
6
-
7
-
8
-
9
-
10
-
11
-
12
-
13
-
14
-
15
-
16
-
17
-
18
-
19
-
20
-
21
-
22
-
23
-
24
-
25
-
26
-
27
-
28
-
29
-
30
-
31
-
32
-
33
-
34
-
35
-
36
-
37
-
38
-
39
-
40
-
41
-
42
-
43
-
44
-
45
-
46
-
47
-
48
-
49
-
50
-
51
-
52
-
53
-
54
-
55
-
56
-
57
-
58
-
59
-
60
-
61
-
62
-
63
-
64
-
65
-
66
-
67
-
68
-
69
-
70
-
71
-
72
-
73
-
74
-
75
-
76
-
77
-
78
-
79
-
80
-
81
-
82
-
83
-
84
-
85
-
86
-
87
-
88
-
89
-
90
-
91
-
92
-
93
-
94
-
95
-
96
-
97
-
98
-
99
-
100
-
101
-
102
-
103
-
104
-
105
-
106
-
107
-
108
-
109
-
110
-
111
-
112
-
113
-
114
-
115
-
116
-
117
-
118
-
119
-
120
-
121
-
122
-
123
-
124
-
125
-
126
-
127
-
128
-
129
-
130
-
131
-
132
-
133
-
134
-
135
-
136
-
137
-
138
-
139
-
140
-
141
-
142
-
143
-
144
-
145
-
146
-
147
-
148
-
149
-
150
-
151
-
152
-
153
-
154
-
155
-
156
-
157
-
158
-
159
-
160
-
161
-
162
-
163
-
164
-
165
-
 166
166 -
 167
167 -
 168
168 -
 169
169 -
 170
170 -
 171
171 -
 172
172 -
 173
173 -
 174
174 -
 175
175 -
 176
176 -
 177
177 -
 178
178 -
 179
179 -
 180
180 -
 181
181 -
 182
182 -
 183
183 -
 184
184 -
 185
185 -
 186
186 -
187
-
188
-
189
-
190
-
191
-
192
-
193
-
194
-
195
-
196
-
197
-
198
-
199
-
200
-
201
-
202
-
203
-
204
-
205
-
206
-
207
-
208
-
209
-
210
-
211
-
212
 |
 |

72
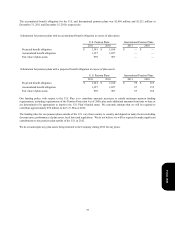
As a result of the use of derivative instruments, the Company is exposed to risk that the counterparties will fail to meet their
contractual obligations. To mitigate the counterparty credit risk, we only enter into contracts with carefully selected major financial
institutions based upon their credit ratings and other factors, and continually assess the creditworthiness of counterparties. At
December 31, 2011 and December 25, 2010, all of the counterparties to our interest rate swaps and foreign currency forwards had
investment grade ratings according to the three major ratings agencies. To date, all counterparties have performed in accordance
with their contractual obligations.
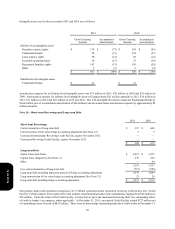
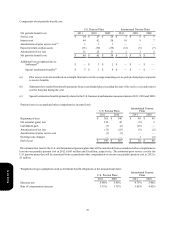
Note 13 – Fair Value Disclosures
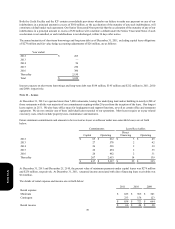
The following table presents fair values for those assets and liabilities measured at fair value on a recurring basis and the level
within the fair value hierarchy in which the measurements fall. No transfers among the levels within the fair value hierarchy
occurred during the years ended December 31, 2011 or December 25, 2010.
Foreign Currency Forwards, net
Interest Rate Swaps, net
Other Investments
Total
Fair Value
Level
2
2
1
2011
$ 2
32
15
$ 49
2010
$ 4
41
14
$ 59
The fair value of the Company’s foreign currency forwards and interest rate swaps were determined based on the present value
of expected future cash flows considering the risks involved, including nonperformance risk, and using discount rates appropriate
for the duration based upon observable inputs. The other investments include investments in mutual funds, which are used to
offset fluctuations in deferred compensation liabilities that employees have chosen to invest in phantom shares of a Stock Index
Fund or Bond Index Fund. The other investments are classified as trading securities and their fair value is determined based on
the closing market prices of the respective mutual funds as of December 31, 2011 and December 25, 2010.
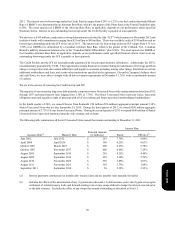
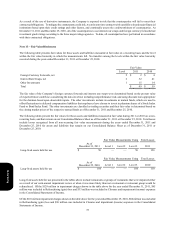
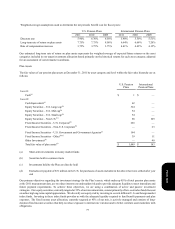
The following tables present the fair values for those assets and liabilities measured at fair value during 2011 or 2010 on a non-
recurring basis, and that remain on our Consolidated Balance Sheet as of December 31, 2011 or December 25, 2010. Total losses
include losses recognized from all non-recurring fair value measurements during the years ended December 31, 2011 and
December 25, 2010 for assets and liabilities that remain on our Consolidated Balance Sheet as of December 31, 2011 or
December 25, 2010:
Long-lived assets held for use
Long-lived assets held for use
As of
December 31, 2011
$ 50
As of
December 25, 2010
$ 184
Fair Value Measurements Using
Level 1
—
Fair Value Measurements Using
Level 1
—
Level 2
—
Level 2
—
Level 3
50
Level 3
184
Total Losses
2011
128
Total Losses
2010
110
Long-lived assets held for use presented in the tables above include restaurants or groups of restaurants that were impaired either
as a result of our semi-annual impairment review or when it was more likely than not a restaurant or restaurant group would be
refranchised. Of the $128 million in impairment charges shown in the table above for the year ended December 31, 2011, $95
million was included in Refranchising (gain) loss and $33 million was included in Closures and impairment (income) expenses
in the Consolidated Statements of Income.
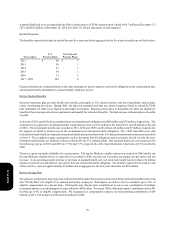
Of the $110 million impairment charges shown in the table above for the year ended December 25, 2010, $80 million was included
in Refranchising (gain) loss and $30 million was included in Closures and impairment (income) expenses in the Consolidated
Statements of Income.
Form 10-K