Pizza Hut 2011 Annual Report Download - page 180
Download and view the complete annual report
Please find page 180 of the 2011 Pizza Hut annual report below. You can navigate through the pages in the report by either clicking on the pages listed below, or by using the keyword search tool below to find specific information within the annual report.-
 1
1 -
2
-
3
-
4
-
5
-
6
-
7
-
8
-
9
-
10
-
11
-
12
-
13
-
14
-
15
-
16
-
17
-
18
-
19
-
20
-
21
-
22
-
23
-
24
-
25
-
26
-
27
-
28
-
29
-
30
-
31
-
32
-
33
-
34
-
35
-
36
-
37
-
38
-
39
-
40
-
41
-
42
-
43
-
44
-
45
-
46
-
47
-
48
-
49
-
50
-
51
-
52
-
53
-
54
-
55
-
56
-
57
-
58
-
59
-
60
-
61
-
62
-
63
-
64
-
65
-
66
-
67
-
68
-
69
-
70
-
71
-
72
-
73
-
74
-
75
-
76
-
77
-
78
-
79
-
80
-
81
-
82
-
83
-
84
-
85
-
86
-
87
-
88
-
89
-
90
-
91
-
92
-
93
-
94
-
95
-
96
-
97
-
98
-
99
-
100
-
101
-
102
-
103
-
104
-
105
-
106
-
107
-
108
-
109
-
110
-
111
-
112
-
113
-
114
-
115
-
116
-
117
-
118
-
119
-
120
-
121
-
122
-
123
-
124
-
125
-
126
-
127
-
128
-
129
-
130
-
131
-
132
-
133
-
134
-
135
-
136
-
137
-
138
-
139
-
140
-
141
-
142
-
143
-
144
-
145
-
146
-
147
-
148
-
149
-
150
-
151
-
152
-
153
-
154
-
155
-
156
-
157
-
158
-
159
-
160
-
161
-
162
-
163
-
164
-
165
-
166
-
167
-
168
-
169
-
 170
170 -
 171
171 -
 172
172 -
 173
173 -
 174
174 -
 175
175 -
 176
176 -
 177
177 -
 178
178 -
 179
179 -
 180
180 -
 181
181 -
 182
182 -
 183
183 -
 184
184 -
 185
185 -
 186
186 -
 187
187 -
 188
188 -
 189
189 -
 190
190 -
191
-
192
-
193
-
194
-
195
-
196
-
197
-
198
-
199
-
200
-
201
-
202
-
203
-
204
-
205
-
206
-
207
-
208
-
209
-
210
-
211
-
212
 |
 |

76
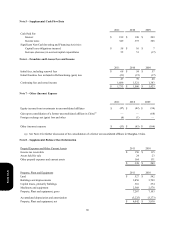
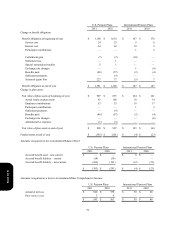
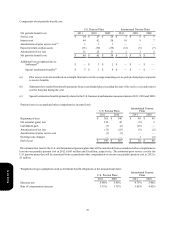
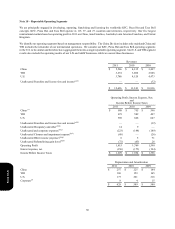
Components of net periodic benefit cost:
Net periodic benefit cost
Service cost
Interest cost
Amortization of prior service cost(a)
Expected return on plan assets
Amortization of net loss
Net periodic benefit cost
Additional loss recognized due to:
Settlement(b)
Special termination benefits(c)
U.S. Pension Plans
2011
$ 24
64
1
(71)
31
$ 49
$ —
$ 5
2010
$ 25
62
1
(70)
23
$ 41
$ 3
$ 1
2009
$ 26
58
1
(59)
13
$ 39
$ 2
$ 4
International Pension Plans
2011
$ 5
10
—
(12)
2
$ 5
$ —
$ —
2010
$ 6
9
—
(9)
2
$ 8
$ —
$ —
2009
$ 5
7
—
(7)
2
$ 7
$ —
$ —
(a) Prior service costs are amortized on a straight-line basis over the average remaining service period of employees expected
to receive benefits.
(b) Settlement loss results from benefit payments from a non-funded plan exceeding the sum of the service cost and interest
cost for that plan during the year.
(c) Special termination benefits primarily related to the U.S. business transformation measures taken in 2011, 2010 and 2009.
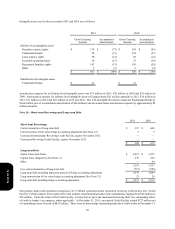
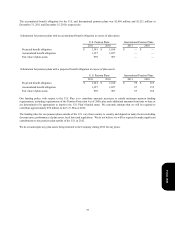
Pension losses in accumulated other comprehensive income (loss):
Beginning of year
Net actuarial (gain) loss
Curtailment gain
Amortization of net loss
Amortization of prior service cost
Exchange rate changes
End of year
U.S. Pension Plans
2011
$ 363
219
(7)
(31)
(1)
—
$ 543
2010
$ 346
43
(2)
(23)
(1)
—
$ 363
International Pension
Plans
2011
$ 46
(5)
(10)
(2)
—
1
$ 30
2010
$ 48
2
—
(2)
—
(2)
$ 46
The estimated net loss for the U.S. and International pension plans that will be amortized from accumulated other comprehensive
loss into net periodic pension cost in 2012 is $63 million and $1 million, respectively. The estimated prior service cost for the
U.S. pension plans that will be amortized from accumulated other comprehensive loss into net periodic pension cost in 2012 is
$1 million.
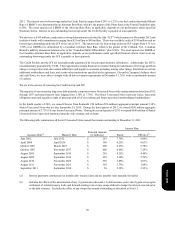
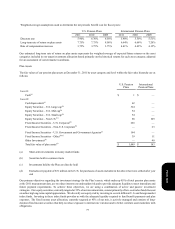
Weighted-average assumptions used to determine benefit obligations at the measurement dates:
Discount rate
Rate of compensation increase
U.S. Pension Plans
2011
4.90%
3.75%
2010
5.90%
3.75%
International Pension
Plans
2011
4.75%
3.85%
2010
5.40%
4.42%
Form 10-K