Pizza Hut 2011 Annual Report Download - page 3
Download and view the complete annual report
Please find page 3 of the 2011 Pizza Hut annual report below. You can navigate through the pages in the report by either clicking on the pages listed below, or by using the keyword search tool below to find specific information within the annual report.-
 1
1 -
 2
2 -
 3
3 -
 4
4 -
 5
5 -
 6
6 -
 7
7 -
 8
8 -
 9
9 -
 10
10 -
 11
11 -
 12
12 -
 13
13 -
 14
14 -
15
-
16
-
17
-
18
-
19
-
20
-
21
-
22
-
23
-
24
-
25
-
26
-
27
-
28
-
29
-
30
-
31
-
32
-
33
-
34
-
35
-
36
-
37
-
38
-
39
-
40
-
41
-
42
-
43
-
44
-
45
-
46
-
47
-
48
-
49
-
50
-
51
-
52
-
53
-
54
-
55
-
56
-
57
-
58
-
59
-
60
-
61
-
62
-
63
-
64
-
65
-
66
-
67
-
68
-
69
-
70
-
71
-
72
-
73
-
74
-
75
-
76
-
77
-
78
-
79
-
80
-
81
-
82
-
83
-
84
-
85
-
86
-
87
-
88
-
89
-
90
-
91
-
92
-
93
-
94
-
95
-
96
-
97
-
98
-
99
-
100
-
101
-
102
-
103
-
104
-
105
-
106
-
107
-
108
-
109
-
110
-
111
-
112
-
113
-
114
-
115
-
116
-
117
-
118
-
119
-
120
-
121
-
122
-
123
-
124
-
125
-
126
-
127
-
128
-
129
-
130
-
131
-
132
-
133
-
134
-
135
-
136
-
137
-
138
-
139
-
140
-
141
-
142
-
143
-
144
-
145
-
146
-
147
-
148
-
149
-
150
-
151
-
152
-
153
-
154
-
155
-
156
-
157
-
158
-
159
-
160
-
161
-
162
-
163
-
164
-
165
-
166
-
167
-
168
-
169
-
170
-
171
-
172
-
173
-
174
-
175
-
176
-
177
-
178
-
179
-
180
-
181
-
182
-
183
-
184
-
185
-
186
-
187
-
188
-
189
-
190
-
191
-
192
-
193
-
194
-
195
-
196
-
197
-
198
-
199
-
200
-
201
-
202
-
203
-
204
-
205
-
206
-
207
-
208
-
209
-
210
-
211
-
212
 |
 |

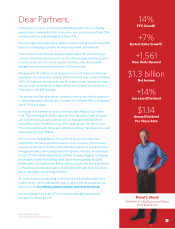
Dear Partners,
I am pleased to report we delivered 14% EPS growth in 2011, excluding
special items, marking the 10th consecutive year we achieved at least 13%
and exceeded our annual target of at least 10%.
We once again demonstrated an ability to deliver strong results even in the
face of a challenging economic and macroeconomic environment.
This is backed up by the fact we grew system sales 7%, prior to foreign
currency translation and proved to be one of the leading retail developers
of units outside the U.S., as we opened 1,561 new units, the eleventh
straight year we’ve opened more than 1,000 new units.
We generated $1.3 billion of net income and over $2 billion in cash from
operations. Our share price jumped 20% for the full year, on top of 40% in
2010. We take special pride that over the long term our five year average
annual return, including stock appreciation and dividend reinvestment, is
17% versus a flat S&P average.
Our strong cash flow generation, combined with our disciplined approach
to deploying capital, allowed us to increase our dividend 14%, to an annual
rate of $1.14 per share.
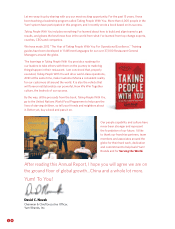
Every year in December we host our Investor and Analyst Day in New
York. This meeting gives us the opportunity to “go public” with our goals
and commitments as well as showcase our management talent from
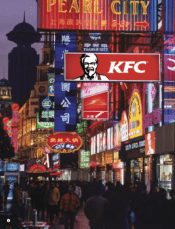
around the world. The theme of our 2011 meeting was “On the Ground
Floor of Global Growth: China and a Whole Lot More.” No statement could
better describe Yum! Brands.
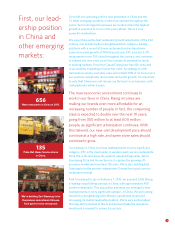
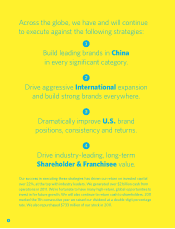
We, of course, highlighted our 10-year track record, but even more
importantly, the future growth prospects of our company. The facts are
we have a portfolio of brands with leadership positions in China and other
emerging markets, with a long runway for growth. We have an asset base
of over 37,000 restaurants and we continue to make progress leveraging
these assets further by building sales layers and expanding dayparts.
Additionally, we invested over $900 million in 2011 in the future growth of
our business and returned cash to shareholders through share buy backs
and a meaningful and growing dividend.
All of this adds up to a growing confidence in our business model. As a
matter of fact, we’re confident the best is yet to come as we pursue our
objective to be the defining global company that feeds the world.
Let me highlight how some of Yum!’s unique strengths position our
company for future growth.
14%
EPS Growth*
+7%
System Sales Growth**
+1,561
New Units Opened
$1.3 billion
Net Income
+14%
Increased Dividend
$1.14
Annual Dividend
Per Share Rate
David C. Novak
Chairman & Chief Executive Officer,
Yum! Brands, Inc.
*Excluding special items
**Prior to foreign currency translation
1